Data
83,911 items of data are available, covering 79,384 participants.
Defined-instances run from 2 to 3, labelled using Instancing
2.
Units of measurement are AU.
| Maximum | 0.002457 |
| Decile 9 | 0.001704 |
| Decile 8 | 0.001678 |
| Decile 7 | 0.001659 |
| Decile 6 | 0.001643 |
| Median | 0.001628 |
| Decile 4 | 0.001614 |
| Decile 3 | 0.001598 |
| Decile 2 | 0.00158 |
| Decile 1 | 0.001555 |
| Minimum | 0.000595 |
|
|
- Mean = 0.00162901
- Std.dev = 5.95814e-05
- 28 items below graph minimum of 0.001406
- 34 items above graph maximum of 0.001853
|
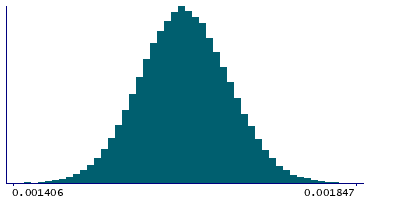
2 Instances
Instance 2 : Imaging visit (2014+)
79,153 participants, 79,153 items
| Maximum | 0.002457 |
| Decile 9 | 0.001705 |
| Decile 8 | 0.001679 |
| Decile 7 | 0.00166 |
| Decile 6 | 0.001644 |
| Median | 0.001629 |
| Decile 4 | 0.001614 |
| Decile 3 | 0.001599 |
| Decile 2 | 0.001581 |
| Decile 1 | 0.001556 |
| Minimum | 0.000595 |
|

|
- Mean = 0.00162971
- Std.dev = 5.9642e-05
- 25 items below graph minimum of 0.001407
- 31 items above graph maximum of 0.001854
|
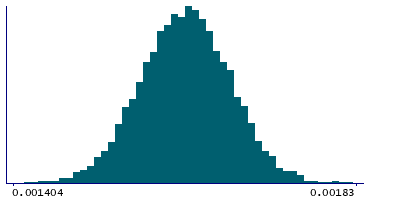
Instance 3 : First repeat imaging visit (2019+)
4,758 participants, 4,758 items
| Maximum | 0.001921 |
| Decile 9 | 0.001688 |
| Decile 8 | 0.001665 |
| Decile 7 | 0.001647 |
| Decile 6 | 0.001632 |
| Median | 0.001618 |
| Decile 4 | 0.001604 |
| Decile 3 | 0.001588 |
| Decile 2 | 0.00157 |
| Decile 1 | 0.001546 |
| Minimum | 0.000979 |
|
|
- Mean = 0.00161739
- Std.dev = 5.73295e-05
- 3 items below graph minimum of 0.001404
- 3 items above graph maximum of 0.00183
|
Notes
Mean L1 in splenium of corpus callosum on FA (fractional anisotropy) skeleton (from dMRI data)
0 Related Data-Fields
There are no related data-fields
2 Applications
| Application ID | Title |
|---|
| 17689 | Genetic, environmental and lifestyle predictors of brain/cognitive-related outcomes. |
| 22783 | The joint analysis of imaging data and genetic data for early tumor detection, prevention, diagnosis and treatment |

