Data
83,911 items of data are available, covering 79,384 participants.
Defined-instances run from 2 to 3, labelled using Instancing
2.
Units of measurement are AU.
| Maximum | 0.00279 |
| Decile 9 | 0.001404 |
| Decile 8 | 0.001348 |
| Decile 7 | 0.001311 |
| Decile 6 | 0.001281 |
| Median | 0.001256 |
| Decile 4 | 0.001231 |
| Decile 3 | 0.001206 |
| Decile 2 | 0.001178 |
| Decile 1 | 0.001141 |
| Minimum | 0 |
|
|
- Mean = 0.00126628
- Std.dev = 0.000107056
- 10 items below graph minimum of 0.000878
- 232 items above graph maximum of 0.001667
|
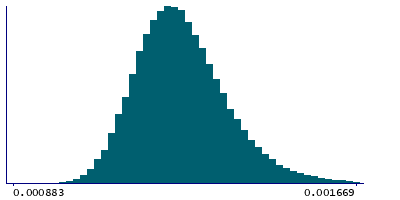
2 Instances
Instance 2 : Imaging visit (2014+)
79,153 participants, 79,153 items
| Maximum | 0.00279 |
| Decile 9 | 0.001403 |
| Decile 8 | 0.001348 |
| Decile 7 | 0.001311 |
| Decile 6 | 0.001281 |
| Median | 0.001256 |
| Decile 4 | 0.001231 |
| Decile 3 | 0.001206 |
| Decile 2 | 0.001178 |
| Decile 1 | 0.001142 |
| Minimum | 0 |
|

|
- Mean = 0.00126639
- Std.dev = 0.000106997
- 10 items below graph minimum of 0.000881
- 229 items above graph maximum of 0.001664
|
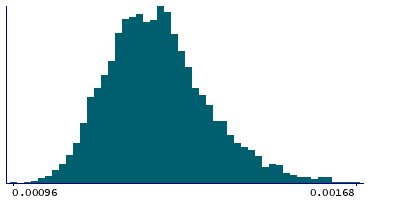
Instance 3 : First repeat imaging visit (2019+)
4,758 participants, 4,758 items
| Maximum | 0.00179 |
| Decile 9 | 0.001407 |
| Decile 8 | 0.001347 |
| Decile 7 | 0.001309 |
| Decile 6 | 0.001281 |
| Median | 0.001256 |
| Decile 4 | 0.001228 |
| Decile 3 | 0.001202 |
| Decile 2 | 0.001174 |
| Decile 1 | 0.001134 |
| Minimum | 0.00096 |
|
|
- Mean = 0.00126433
- Std.dev = 0.000108019
- 8 items above graph maximum of 0.00168
|
Notes
Mean L1 in corticospinal tract (right) on FA (fractional anisotropy) skeleton (from dMRI data)
0 Related Data-Fields
There are no related data-fields
2 Applications
| Application ID | Title |
|---|
| 17689 | Genetic, environmental and lifestyle predictors of brain/cognitive-related outcomes. |
| 22783 | The joint analysis of imaging data and genetic data for early tumor detection, prevention, diagnosis and treatment |

