Data
83,911 items of data are available, covering 79,384 participants.
Defined-instances run from 2 to 3, labelled using Instancing
2.
Units of measurement are AU.
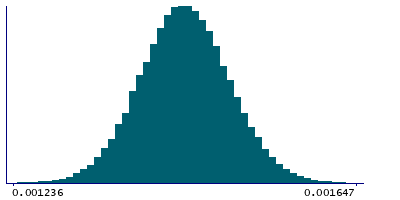
| Maximum | 0.001877 |
| Decile 9 | 0.001506 |
| Decile 8 | 0.001482 |
| Decile 7 | 0.001465 |
| Decile 6 | 0.00145 |
| Median | 0.001437 |
| Decile 4 | 0.001424 |
| Decile 3 | 0.001409 |
| Decile 2 | 0.001393 |
| Decile 1 | 0.001369 |
| Minimum | 0 |
|
|
- Mean = 0.00143707
- Std.dev = 5.58394e-05
- 59 items below graph minimum of 0.001232
- 23 items above graph maximum of 0.001643
|
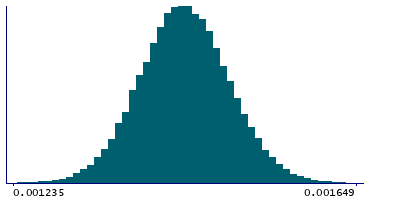
2 Instances
Instance 2 : Imaging visit (2014+)
79,153 participants, 79,153 items
| Maximum | 0.001877 |
| Decile 9 | 0.001506 |
| Decile 8 | 0.001482 |
| Decile 7 | 0.001465 |
| Decile 6 | 0.00145 |
| Median | 0.001437 |
| Decile 4 | 0.001423 |
| Decile 3 | 0.001409 |
| Decile 2 | 0.001392 |
| Decile 1 | 0.001369 |
| Minimum | 0 |
|
|
- Mean = 0.00143695
- Std.dev = 5.59941e-05
- 55 items below graph minimum of 0.001232
- 22 items above graph maximum of 0.001643
|
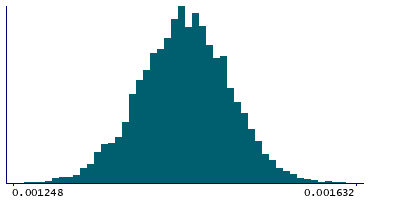
Instance 3 : First repeat imaging visit (2019+)
4,758 participants, 4,758 items
| Maximum | 0.001648 |
| Decile 9 | 0.001504 |
| Decile 8 | 0.001482 |
| Decile 7 | 0.001465 |
| Decile 6 | 0.0014525 |
| Median | 0.00144 |
| Decile 4 | 0.001428 |
| Decile 3 | 0.001414 |
| Decile 2 | 0.001397 |
| Decile 1 | 0.001376 |
| Minimum | 0.000632 |
|
|
- Mean = 0.00143897
- Std.dev = 5.31634e-05
- 5 items below graph minimum of 0.001248
- 1 item above graph maximum of 0.001632
|
Notes
Mean L1 in cerebral peduncle (right) on FA (fractional anisotropy) skeleton (from dMRI data)
0 Related Data-Fields
There are no related data-fields
2 Applications
| Application ID | Title |
|---|
| 17689 | Genetic, environmental and lifestyle predictors of brain/cognitive-related outcomes. |
| 22783 | The joint analysis of imaging data and genetic data for early tumor detection, prevention, diagnosis and treatment |

