Data
83,911 items of data are available, covering 79,384 participants.
Defined-instances run from 2 to 3, labelled using Instancing
2.
Units of measurement are AU.
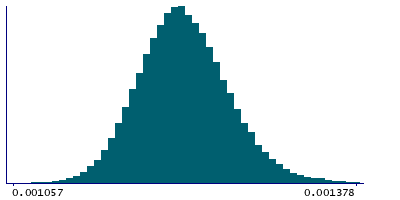
| Maximum | 0.001965 |
| Decile 9 | 0.001275 |
| Decile 8 | 0.001254 |
| Decile 7 | 0.00124 |
| Decile 6 | 0.001228 |
| Median | 0.001217 |
| Decile 4 | 0.001207 |
| Decile 3 | 0.001196 |
| Decile 2 | 0.001183 |
| Decile 1 | 0.001166 |
| Minimum | 0.000846 |
|
|
- Mean = 0.00121975
- Std.dev = 4.47202e-05
- 21 items below graph minimum of 0.001057
- 241 items above graph maximum of 0.001384
|
2 Instances
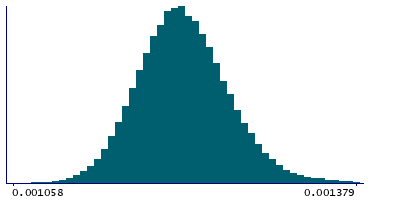
Instance 2 : Imaging visit (2014+)
79,153 participants, 79,153 items
| Maximum | 0.001965 |
| Decile 9 | 0.001276 |
| Decile 8 | 0.001255 |
| Decile 7 | 0.00124 |
| Decile 6 | 0.001229 |
| Median | 0.001218 |
| Decile 4 | 0.001208 |
| Decile 3 | 0.001197 |
| Decile 2 | 0.001184 |
| Decile 1 | 0.001167 |
| Minimum | 0.000846 |
|
|
- Mean = 0.00122037
- Std.dev = 4.48816e-05
- 20 items below graph minimum of 0.001058
- 227 items above graph maximum of 0.001385
|
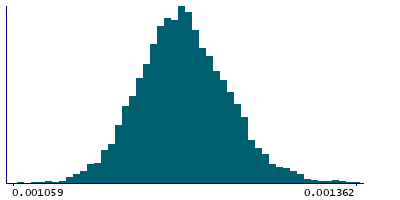
Instance 3 : First repeat imaging visit (2019+)
4,758 participants, 4,758 items
| Maximum | 0.001442 |
| Decile 9 | 0.001261 |
| Decile 8 | 0.001242 |
| Decile 7 | 0.001229 |
| Decile 6 | 0.001217 |
| Median | 0.001208 |
| Decile 4 | 0.001198 |
| Decile 3 | 0.001188 |
| Decile 2 | 0.001176 |
| Decile 1 | 0.00116 |
| Minimum | 0.00101 |
|
|
- Mean = 0.00120952
- Std.dev = 4.05991e-05
- 1 item below graph minimum of 0.001059
- 8 items above graph maximum of 0.001362
|
Notes
Mean L1 in superior longitudinal fasciculus (right) on FA (fractional anisotropy) skeleton (from dMRI data)
0 Related Data-Fields
There are no related data-fields
2 Applications
| Application ID | Title |
|---|
| 17689 | Genetic, environmental and lifestyle predictors of brain/cognitive-related outcomes. |
| 22783 | The joint analysis of imaging data and genetic data for early tumor detection, prevention, diagnosis and treatment |

