Data
83,911 items of data are available, covering 79,384 participants.
Defined-instances run from 2 to 3, labelled using Instancing
2.
Units of measurement are AU.
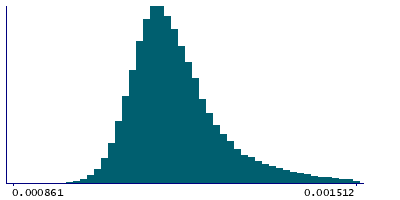
| Maximum | 0.00305 |
| Decile 9 | 0.001311 |
| Decile 8 | 0.001241 |
| Decile 7 | 0.001205 |
| Decile 6 | 0.00118 |
| Median | 0.001159 |
| Decile 4 | 0.001141 |
| Decile 3 | 0.001123 |
| Decile 2 | 0.001104 |
| Decile 1 | 0.001079 |
| Minimum | 0.000566 |
|
|
- Mean = 0.00118157
- Std.dev = 0.000107262
- 8 items below graph minimum of 0.000847
- 980 items above graph maximum of 0.001543
|
2 Instances
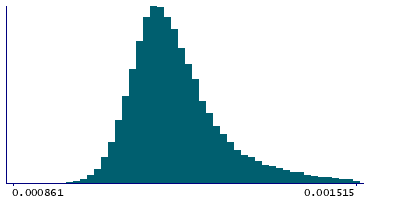
Instance 2 : Imaging visit (2014+)
79,153 participants, 79,153 items
| Maximum | 0.00305 |
| Decile 9 | 0.001312 |
| Decile 8 | 0.001242 |
| Decile 7 | 0.001206 |
| Decile 6 | 0.001181 |
| Median | 0.00116 |
| Decile 4 | 0.001141 |
| Decile 3 | 0.001124 |
| Decile 2 | 0.001105 |
| Decile 1 | 0.001079 |
| Minimum | 0.000566 |
|
|
- Mean = 0.00118252
- Std.dev = 0.000107787
- 8 items below graph minimum of 0.000846
- 932 items above graph maximum of 0.001545
|
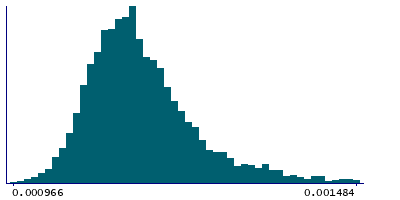
Instance 3 : First repeat imaging visit (2019+)
4,758 participants, 4,758 items
| Maximum | 0.002162 |
| Decile 9 | 0.0012785 |
| Decile 8 | 0.001219 |
| Decile 7 | 0.001188 |
| Decile 6 | 0.001166 |
| Median | 0.001147 |
| Decile 4 | 0.001131 |
| Decile 3 | 0.001113 |
| Decile 2 | 0.001095 |
| Decile 1 | 0.001072 |
| Minimum | 0.000966 |
|
|
- Mean = 0.00116565
- Std.dev = 9.67502e-05
- 66 items above graph maximum of 0.001485
|
Notes
Mean L1 in superior fronto-occipital fasciculus (left) on FA (fractional anisotropy) skeleton (from dMRI data)
0 Related Data-Fields
There are no related data-fields
2 Applications
| Application ID | Title |
|---|
| 17689 | Genetic, environmental and lifestyle predictors of brain/cognitive-related outcomes. |
| 22783 | The joint analysis of imaging data and genetic data for early tumor detection, prevention, diagnosis and treatment |

