Data
83,911 items of data are available, covering 79,384 participants.
Defined-instances run from 2 to 3, labelled using Instancing
2.
Units of measurement are AU.
| Maximum | 0.001568 |
| Decile 9 | 0.000524 |
| Decile 8 | 0.000504 |
| Decile 7 | 0.00049 |
| Decile 6 | 0.000479 |
| Median | 0.000469 |
| Decile 4 | 0.00046 |
| Decile 3 | 0.00045 |
| Decile 2 | 0.000439 |
| Decile 1 | 0.000424 |
| Minimum | 0 |
|
|
- Mean = 0.000472578
- Std.dev = 4.17913e-05
- 3 items below graph minimum of 0.000324
- 226 items above graph maximum of 0.000624
|
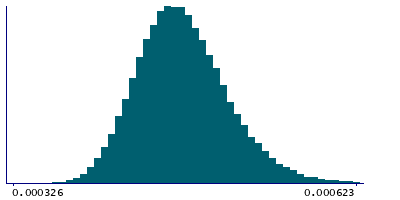
2 Instances
Instance 2 : Imaging visit (2014+)
79,153 participants, 79,153 items
| Maximum | 0.001568 |
| Decile 9 | 0.000525 |
| Decile 8 | 0.000504 |
| Decile 7 | 0.000491 |
| Decile 6 | 0.000479 |
| Median | 0.00047 |
| Decile 4 | 0.00046 |
| Decile 3 | 0.00045 |
| Decile 2 | 0.000439 |
| Decile 1 | 0.000424 |
| Minimum | 0 |
|

|
- Mean = 0.000472928
- Std.dev = 4.19181e-05
- 3 items below graph minimum of 0.000323
- 211 items above graph maximum of 0.000626
|
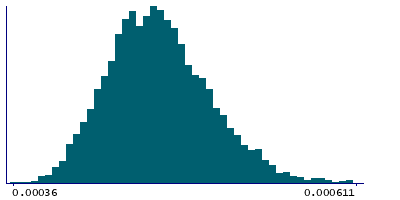
Instance 3 : First repeat imaging visit (2019+)
4,758 participants, 4,758 items
| Maximum | 0.001137 |
| Decile 9 | 0.000516 |
| Decile 8 | 0.000497 |
| Decile 7 | 0.000483 |
| Decile 6 | 0.000473 |
| Median | 0.000464 |
| Decile 4 | 0.000455 |
| Decile 3 | 0.000445 |
| Decile 2 | 0.000435 |
| Decile 1 | 0.000421 |
| Minimum | 0.00036 |
|
|
- Mean = 0.000466744
- Std.dev = 3.91648e-05
- 9 items above graph maximum of 0.000611
|
Notes
Mean L2 in superior cerebellar peduncle (left) on FA (fractional anisotropy) skeleton (from dMRI data)
0 Related Data-Fields
There are no related data-fields
2 Applications
| Application ID | Title |
|---|
| 17689 | Genetic, environmental and lifestyle predictors of brain/cognitive-related outcomes. |
| 22783 | The joint analysis of imaging data and genetic data for early tumor detection, prevention, diagnosis and treatment |

