Data
83,911 items of data are available, covering 79,384 participants.
Defined-instances run from 2 to 3, labelled using Instancing
2.
Units of measurement are AU.
| Maximum | 0.001914 |
| Decile 9 | 0.000649 |
| Decile 8 | 0.000627 |
| Decile 7 | 0.000612 |
| Decile 6 | 0.0006 |
| Median | 0.000589 |
| Decile 4 | 0.000578 |
| Decile 3 | 0.000567 |
| Decile 2 | 0.000553 |
| Decile 1 | 0.000536 |
| Minimum | 0 |
|
|
- Mean = 0.000591406
- Std.dev = 4.67779e-05
- 13 items below graph minimum of 0.000423
- 196 items above graph maximum of 0.000762
|
2 Instances
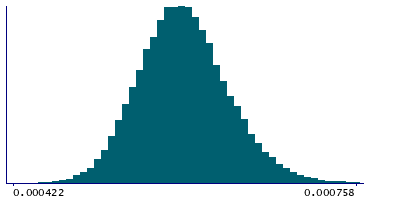
Instance 2 : Imaging visit (2014+)
79,153 participants, 79,153 items
| Maximum | 0.001914 |
| Decile 9 | 0.00065 |
| Decile 8 | 0.000628 |
| Decile 7 | 0.000613 |
| Decile 6 | 0.000601 |
| Median | 0.00059 |
| Decile 4 | 0.000579 |
| Decile 3 | 0.000567 |
| Decile 2 | 0.000554 |
| Decile 1 | 0.000536 |
| Minimum | 0 |
|
|
- Mean = 0.000592065
- Std.dev = 4.67305e-05
- 12 items below graph minimum of 0.000422
- 183 items above graph maximum of 0.000764
|
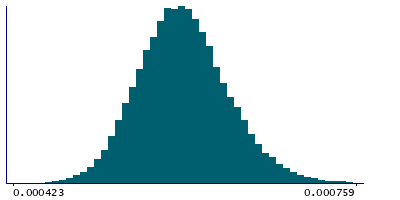
Instance 3 : First repeat imaging visit (2019+)
4,758 participants, 4,758 items
| Maximum | 0.001252 |
| Decile 9 | 0.000635 |
| Decile 8 | 0.000614 |
| Decile 7 | 0.000601 |
| Decile 6 | 0.000589 |
| Median | 0.000578 |
| Decile 4 | 0.000568 |
| Decile 3 | 0.000557 |
| Decile 2 | 0.000544 |
| Decile 1 | 0.000526 |
| Minimum | 0.00042 |
|

|
- Mean = 0.000580439
- Std.dev = 4.61988e-05
- 10 items above graph maximum of 0.000744
|
Notes
Mean L2 in uncinate fasciculus (right) on FA (fractional anisotropy) skeleton (from dMRI data)
0 Related Data-Fields
There are no related data-fields
2 Applications
| Application ID | Title |
|---|
| 17689 | Genetic, environmental and lifestyle predictors of brain/cognitive-related outcomes. |
| 22783 | The joint analysis of imaging data and genetic data for early tumor detection, prevention, diagnosis and treatment |

