Data
83,911 items of data are available, covering 79,384 participants.
Defined-instances run from 2 to 3, labelled using Instancing
2.
Units of measurement are AU.
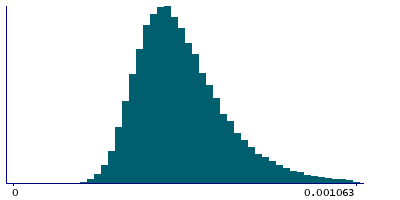
| Maximum | 0.002834 |
| Decile 9 | 0.000728 |
| Decile 8 | 0.000637 |
| Decile 7 | 0.000582 |
| Decile 6 | 0.00054 |
| Median | 0.000505 |
| Decile 4 | 0.000473 |
| Decile 3 | 0.000443 |
| Decile 2 | 0.000409 |
| Decile 1 | 0.000368 |
| Minimum | -0.000175 |
|
|
- Mean = 0.000531904
- Std.dev = 0.000153285
- 1 item below graph minimum of 0
- 500 items above graph maximum of 0.001088
|
2 Instances
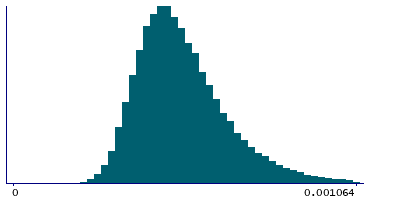
Instance 2 : Imaging visit (2014+)
79,153 participants, 79,153 items
| Maximum | 0.002834 |
| Decile 9 | 0.000729 |
| Decile 8 | 0.000638 |
| Decile 7 | 0.000583 |
| Decile 6 | 0.000542 |
| Median | 0.000506 |
| Decile 4 | 0.000474 |
| Decile 3 | 0.000443 |
| Decile 2 | 0.00041 |
| Decile 1 | 0.000369 |
| Minimum | 0 |
|
|
- Mean = 0.000533067
- Std.dev = 0.000153807
- 481 items above graph maximum of 0.001089
|
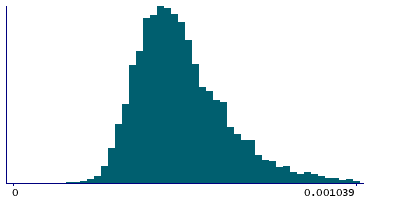
Instance 3 : First repeat imaging visit (2019+)
4,758 participants, 4,758 items
| Maximum | 0.001409 |
| Decile 9 | 0.0006995 |
| Decile 8 | 0.0006155 |
| Decile 7 | 0.00056 |
| Decile 6 | 0.00052 |
| Median | 0.000488 |
| Decile 4 | 0.000458 |
| Decile 3 | 0.000428 |
| Decile 2 | 0.000398 |
| Decile 1 | 0.000359 |
| Minimum | -0.000175 |
|
|
- Mean = 0.000512557
- Std.dev = 0.000142947
- 1 item below graph minimum of 0
- 22 items above graph maximum of 0.00104
|
Notes
Mean L3 in tapetum (left) on FA (fractional anisotropy) skeleton (from dMRI data)
0 Related Data-Fields
There are no related data-fields
2 Applications
| Application ID | Title |
|---|
| 17689 | Genetic, environmental and lifestyle predictors of brain/cognitive-related outcomes. |
| 22783 | The joint analysis of imaging data and genetic data for early tumor detection, prevention, diagnosis and treatment |

