Data
83,906 items of data are available, covering 79,379 participants.
Defined-instances run from 2 to 3, labelled using Instancing
2.
Units of measurement are AU.
| Maximum | 0.99 |
| Decile 9 | 0.766158 |
| Decile 8 | 0.748431 |
| Decile 7 | 0.735635 |
| Decile 6 | 0.724211 |
| Median | 0.713517 |
| Decile 4 | 0.702505 |
| Decile 3 | 0.690054 |
| Decile 2 | 0.674816 |
| Decile 1 | 0.651949 |
| Minimum | 0 |
|

|
- Mean = 0.711029
- Std.dev = 0.0461601
- 86 items below graph minimum of 0.53774
- 38 items above graph maximum of 0.880367
|
2 Instances
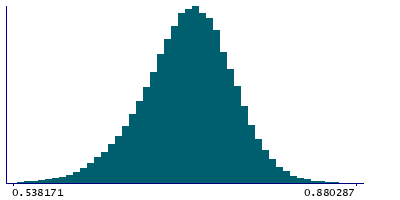
Instance 2 : Imaging visit (2014+)
79,148 participants, 79,148 items
| Maximum | 0.99 |
| Decile 9 | 0.766072 |
| Decile 8 | 0.748312 |
| Decile 7 | 0.73554 |
| Decile 6 | 0.724079 |
| Median | 0.713348 |
| Decile 4 | 0.702367 |
| Decile 3 | 0.689908 |
| Decile 2 | 0.674592 |
| Decile 1 | 0.65171 |
| Minimum | 0 |
|
|
- Mean = 0.710878
- Std.dev = 0.0462366
- 82 items below graph minimum of 0.537349
- 35 items above graph maximum of 0.880433
|
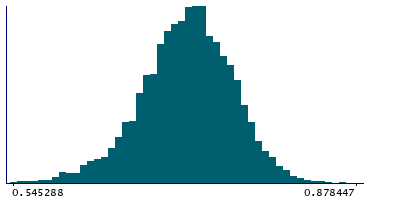
Instance 3 : First repeat imaging visit (2019+)
4,758 participants, 4,758 items
| Maximum | 0.95524 |
| Decile 9 | 0.767389 |
| Decile 8 | 0.751032 |
| Decile 7 | 0.737472 |
| Decile 6 | 0.725955 |
| Median | 0.715585 |
| Decile 4 | 0.704424 |
| Decile 3 | 0.692648 |
| Decile 2 | 0.678102 |
| Decile 1 | 0.656275 |
| Minimum | 0.506408 |
|
|
- Mean = 0.713537
- Std.dev = 0.0447939
- 2 items below graph minimum of 0.545161
- 3 items above graph maximum of 0.878503
|
Notes
Mean ICVF (intra-cellular volume fraction) in corticospinal tract (right) on FA (fractional anisotropy) skeleton (from dMRI data)
0 Related Data-Fields
There are no related data-fields
2 Applications
| Application ID | Title |
|---|
| 17689 | Genetic, environmental and lifestyle predictors of brain/cognitive-related outcomes. |
| 22783 | The joint analysis of imaging data and genetic data for early tumor detection, prevention, diagnosis and treatment |

