Data
83,906 items of data are available, covering 79,379 participants.
Defined-instances run from 2 to 3, labelled using Instancing
2.
Units of measurement are AU.
| Maximum | 0.99 |
| Decile 9 | 0.53771 |
| Decile 8 | 0.524018 |
| Decile 7 | 0.514328 |
| Decile 6 | 0.506361 |
| Median | 0.498836 |
| Decile 4 | 0.491494 |
| Decile 3 | 0.483537 |
| Decile 2 | 0.474113 |
| Decile 1 | 0.461114 |
| Minimum | 0 |
|

|
- Mean = 0.499341
- Std.dev = 0.031724
- 29 items below graph minimum of 0.384518
- 64 items above graph maximum of 0.614306
|
2 Instances
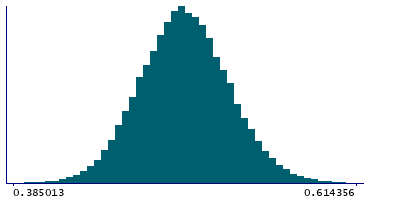
Instance 2 : Imaging visit (2014+)
79,148 participants, 79,148 items
| Maximum | 0.99 |
| Decile 9 | 0.537461 |
| Decile 8 | 0.523726 |
| Decile 7 | 0.514105 |
| Decile 6 | 0.506076 |
| Median | 0.498574 |
| Decile 4 | 0.491247 |
| Decile 3 | 0.483249 |
| Decile 2 | 0.473789 |
| Decile 1 | 0.460847 |
| Minimum | 0 |
|
|
- Mean = 0.499076
- Std.dev = 0.0317341
- 27 items below graph minimum of 0.384234
- 62 items above graph maximum of 0.614074
|
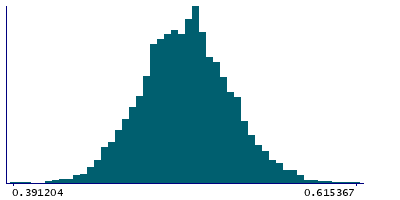
Instance 3 : First repeat imaging visit (2019+)
4,758 participants, 4,758 items
| Maximum | 0.964177 |
| Decile 9 | 0.54064 |
| Decile 8 | 0.527904 |
| Decile 7 | 0.518199 |
| Decile 6 | 0.510536 |
| Median | 0.50367 |
| Decile 4 | 0.495914 |
| Decile 3 | 0.488044 |
| Decile 2 | 0.479684 |
| Decile 1 | 0.465911 |
| Minimum | 0.356328 |
|
|
- Mean = 0.503751
- Std.dev = 0.0312269
- 2 items below graph minimum of 0.391182
- 3 items above graph maximum of 0.615369
|
Notes
Mean ICVF (intra-cellular volume fraction) in cingulum hippocampus (left) on FA (fractional anisotropy) skeleton (from dMRI data)
0 Related Data-Fields
There are no related data-fields
2 Applications
| Application ID | Title |
|---|
| 17689 | Genetic, environmental and lifestyle predictors of brain/cognitive-related outcomes. |
| 22783 | The joint analysis of imaging data and genetic data for early tumor detection, prevention, diagnosis and treatment |

