Data
83,906 items of data are available, covering 79,379 participants.
Defined-instances run from 2 to 3, labelled using Instancing
2.
Units of measurement are AU.
| Maximum | 0.99 |
| Decile 9 | 0.676887 |
| Decile 8 | 0.657429 |
| Decile 7 | 0.642796 |
| Decile 6 | 0.629013 |
| Median | 0.615194 |
| Decile 4 | 0.600175 |
| Decile 3 | 0.582029 |
| Decile 2 | 0.55606 |
| Decile 1 | 0.510693 |
| Minimum | 0.03333 |
|
|
- Mean = 0.602495
- Std.dev = 0.0714628
- 572 items below graph minimum of 0.344499
- 34 items above graph maximum of 0.843081
|
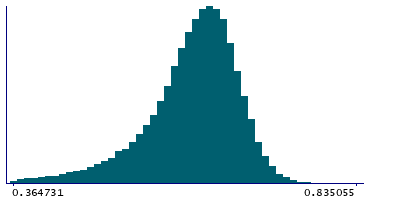
2 Instances
Instance 2 : Imaging visit (2014+)
79,148 participants, 79,148 items
| Maximum | 0.99 |
| Decile 9 | 0.676559 |
| Decile 8 | 0.657001 |
| Decile 7 | 0.642373 |
| Decile 6 | 0.628548 |
| Median | 0.614561 |
| Decile 4 | 0.59945 |
| Decile 3 | 0.581185 |
| Decile 2 | 0.555057 |
| Decile 1 | 0.50971 |
| Minimum | 0.03333 |
|

|
- Mean = 0.601805
- Std.dev = 0.0717597
- 539 items below graph minimum of 0.342861
- 31 items above graph maximum of 0.843409
|
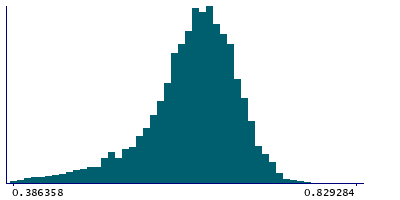
Instance 3 : First repeat imaging visit (2019+)
4,758 participants, 4,758 items
| Maximum | 0.988855 |
| Decile 9 | 0.681628 |
| Decile 8 | 0.663169 |
| Decile 7 | 0.64871 |
| Decile 6 | 0.63663 |
| Median | 0.624073 |
| Decile 4 | 0.611237 |
| Decile 3 | 0.595533 |
| Decile 2 | 0.574501 |
| Decile 1 | 0.533842 |
| Minimum | 0.140396 |
|
|
- Mean = 0.613966
- Std.dev = 0.0652692
- 43 items below graph minimum of 0.386057
- 3 items above graph maximum of 0.829414
|
Notes
Mean ICVF (intra-cellular volume fraction) in superior fronto-occipital fasciculus (left) on FA (fractional anisotropy) skeleton (from dMRI data)
0 Related Data-Fields
There are no related data-fields
2 Applications
| Application ID | Title |
|---|
| 17689 | Genetic, environmental and lifestyle predictors of brain/cognitive-related outcomes. |
| 22783 | The joint analysis of imaging data and genetic data for early tumor detection, prevention, diagnosis and treatment |

