Data
83,906 items of data are available, covering 79,379 participants.
Defined-instances run from 2 to 3, labelled using Instancing
2.
Units of measurement are AU.
| Maximum | 0.99 |
| Decile 9 | 0.5449 |
| Decile 8 | 0.531532 |
| Decile 7 | 0.522068 |
| Decile 6 | 0.513852 |
| Median | 0.50618 |
| Decile 4 | 0.498377 |
| Decile 3 | 0.48997 |
| Decile 2 | 0.480278 |
| Decile 1 | 0.466134 |
| Minimum | 0 |
|
|
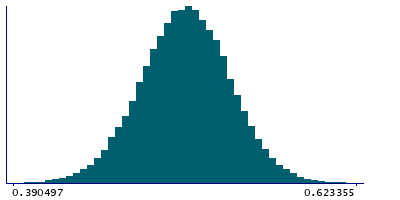
- Mean = 0.505927
- Std.dev = 0.0324445
- 54 items below graph minimum of 0.387369
- 62 items above graph maximum of 0.623665
|
2 Instances
Instance 2 : Imaging visit (2014+)
79,148 participants, 79,148 items
| Maximum | 0.99 |
| Decile 9 | 0.544642 |
| Decile 8 | 0.531218 |
| Decile 7 | 0.521714 |
| Decile 6 | 0.513498 |
| Median | 0.505821 |
| Decile 4 | 0.498028 |
| Decile 3 | 0.489565 |
| Decile 2 | 0.479847 |
| Decile 1 | 0.465676 |
| Minimum | 0 |
|

|
- Mean = 0.505563
- Std.dev = 0.0324969
- 51 items below graph minimum of 0.38671
- 57 items above graph maximum of 0.623608
|
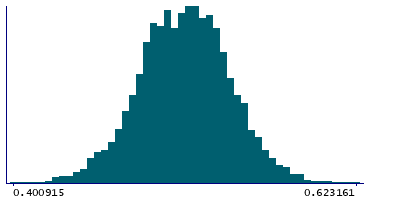
Instance 3 : First repeat imaging visit (2019+)
4,758 participants, 4,758 items
| Maximum | 0.985032 |
| Decile 9 | 0.549075 |
| Decile 8 | 0.53588 |
| Decile 7 | 0.527518 |
| Decile 6 | 0.51961 |
| Median | 0.512143 |
| Decile 4 | 0.50406 |
| Decile 3 | 0.496054 |
| Decile 2 | 0.487484 |
| Decile 1 | 0.474982 |
| Minimum | 0.400421 |
|
|
- Mean = 0.511977
- Std.dev = 0.030939
- 1 item below graph minimum of 0.400889
- 5 items above graph maximum of 0.623168
|
Notes
Mean ICVF (intra-cellular volume fraction) in uncinate fasciculus (left) on FA (fractional anisotropy) skeleton (from dMRI data)
0 Related Data-Fields
There are no related data-fields
2 Applications
| Application ID | Title |
|---|
| 17689 | Genetic, environmental and lifestyle predictors of brain/cognitive-related outcomes. |
| 22783 | The joint analysis of imaging data and genetic data for early tumor detection, prevention, diagnosis and treatment |

