Data
83,906 items of data are available, covering 79,379 participants.
Defined-instances run from 2 to 3, labelled using Instancing
2.
Units of measurement are AU.
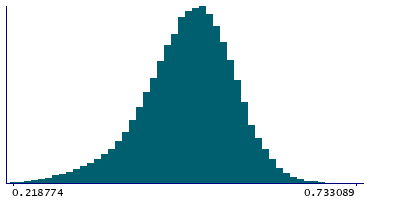
| Maximum | 0.99 |
| Decile 9 | 0.563367 |
| Decile 8 | 0.538291 |
| Decile 7 | 0.519322 |
| Decile 6 | 0.502557 |
| Median | 0.486262 |
| Decile 4 | 0.469236 |
| Decile 3 | 0.449841 |
| Decile 2 | 0.425341 |
| Decile 1 | 0.3872 |
| Minimum | 0 |
|
|
- Mean = 0.480072
- Std.dev = 0.0713858
- 67 items below graph minimum of 0.211033
- 32 items above graph maximum of 0.739534
|
2 Instances
Instance 2 : Imaging visit (2014+)
79,148 participants, 79,148 items
| Maximum | 0.99 |
| Decile 9 | 0.56363 |
| Decile 8 | 0.538538 |
| Decile 7 | 0.519473 |
| Decile 6 | 0.502676 |
| Median | 0.486263 |
| Decile 4 | 0.469221 |
| Decile 3 | 0.44965 |
| Decile 2 | 0.42502 |
| Decile 1 | 0.386745 |
| Minimum | 0 |
|

|
- Mean = 0.480061
- Std.dev = 0.0715691
- 61 items below graph minimum of 0.20986
- 30 items above graph maximum of 0.740515
|
Instance 3 : First repeat imaging visit (2019+)
4,758 participants, 4,758 items
| Maximum | 0.97041 |
| Decile 9 | 0.558546 |
| Decile 8 | 0.533901 |
| Decile 7 | 0.516883 |
| Decile 6 | 0.501205 |
| Median | 0.486221 |
| Decile 4 | 0.469969 |
| Decile 3 | 0.452078 |
| Decile 2 | 0.429986 |
| Decile 1 | 0.394059 |
| Minimum | 0.19355 |
|

|
- Mean = 0.480258
- Std.dev = 0.068264
- 6 items below graph minimum of 0.229572
- 2 items above graph maximum of 0.723033
|
Notes
Mean ICVF (intra-cellular volume fraction) in tapetum (right) on FA (fractional anisotropy) skeleton (from dMRI data)
0 Related Data-Fields
There are no related data-fields
2 Applications
| Application ID | Title |
|---|
| 17689 | Genetic, environmental and lifestyle predictors of brain/cognitive-related outcomes. |
| 22783 | The joint analysis of imaging data and genetic data for early tumor detection, prevention, diagnosis and treatment |

