Data
83,906 items of data are available, covering 79,379 participants.
Defined-instances run from 2 to 3, labelled using Instancing
2.
Units of measurement are AU.
| Maximum | 0.689616 |
| Decile 9 | 0.217753 |
| Decile 8 | 0.210761 |
| Decile 7 | 0.206062 |
| Decile 6 | 0.202155 |
| Median | 0.198584 |
| Decile 4 | 0.195026 |
| Decile 3 | 0.191347 |
| Decile 2 | 0.187071 |
| Decile 1 | 0.181331 |
| Minimum | 0 |
|
|
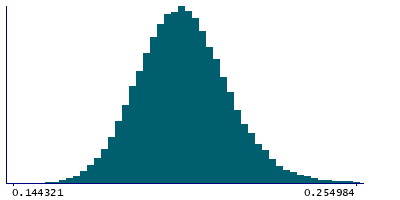
- Mean = 0.199409
- Std.dev = 0.0157713
- 4 items below graph minimum of 0.144908
- 299 items above graph maximum of 0.254175
|
2 Instances
Instance 2 : Imaging visit (2014+)
79,148 participants, 79,148 items
| Maximum | 0.486999 |
| Decile 9 | 0.217519 |
| Decile 8 | 0.210552 |
| Decile 7 | 0.205815 |
| Decile 6 | 0.201902 |
| Median | 0.198341 |
| Decile 4 | 0.194781 |
| Decile 3 | 0.191115 |
| Decile 2 | 0.186846 |
| Decile 1 | 0.181098 |
| Minimum | 0 |
|

|
- Mean = 0.199174
- Std.dev = 0.0157062
- 4 items below graph minimum of 0.144676
- 288 items above graph maximum of 0.25394
|
Instance 3 : First repeat imaging visit (2019+)
4,758 participants, 4,758 items
| Maximum | 0.689616 |
| Decile 9 | 0.220706 |
| Decile 8 | 0.214073 |
| Decile 7 | 0.209607 |
| Decile 6 | 0.205876 |
| Median | 0.202532 |
| Decile 4 | 0.199064 |
| Decile 3 | 0.195442 |
| Decile 2 | 0.191444 |
| Decile 1 | 0.185899 |
| Minimum | 0.155236 |
|

|
- Mean = 0.203323
- Std.dev = 0.0163285
- 14 items above graph maximum of 0.255513
|
Notes
Mean OD (orientation dispersion index) in middle cerebellar peduncle on FA (fractional anisotropy) skeleton (from dMRI data)
0 Related Data-Fields
There are no related data-fields
2 Applications
| Application ID | Title |
|---|
| 17689 | Genetic, environmental and lifestyle predictors of brain/cognitive-related outcomes. |
| 22783 | The joint analysis of imaging data and genetic data for early tumor detection, prevention, diagnosis and treatment |

