Data
83,906 items of data are available, covering 79,379 participants.
Defined-instances run from 2 to 3, labelled using Instancing
2.
Units of measurement are AU.
| Maximum | 0.600602 |
| Decile 9 | 0.068511 |
| Decile 8 | 0.065295 |
| Decile 7 | 0.063192 |
| Decile 6 | 0.061484 |
| Median | 0.059972 |
| Decile 4 | 0.058528 |
| Decile 3 | 0.057069 |
| Decile 2 | 0.055433 |
| Decile 1 | 0.053362 |
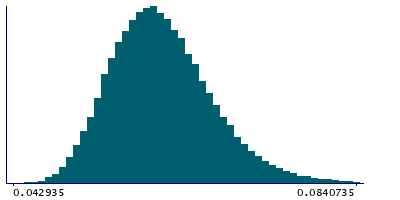
| Minimum | 0.042935 |
|

|
- Mean = 0.0607109
- Std.dev = 0.00932912
- 263 items above graph maximum of 0.08366
|
2 Instances
Instance 2 : Imaging visit (2014+)
79,148 participants, 79,148 items
| Maximum | 0.600602 |
| Decile 9 | 0.0685155 |
| Decile 8 | 0.065299 |
| Decile 7 | 0.063193 |
| Decile 6 | 0.0614835 |
| Median | 0.059973 |
| Decile 4 | 0.058532 |
| Decile 3 | 0.057065 |
| Decile 2 | 0.0554295 |
| Decile 1 | 0.0533545 |
| Minimum | 0.042935 |
|
|
- Mean = 0.0607033
- Std.dev = 0.00918067
- 248 items above graph maximum of 0.0836765
|
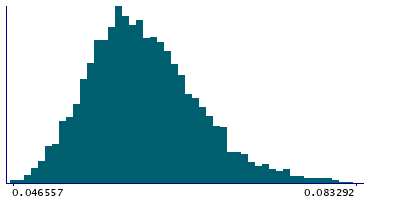
Instance 3 : First repeat imaging visit (2019+)
4,758 participants, 4,758 items
| Maximum | 0.513037 |
| Decile 9 | 0.0684065 |
| Decile 8 | 0.0652405 |
| Decile 7 | 0.063172 |
| Decile 6 | 0.061513 |
| Median | 0.059955 |
| Decile 4 | 0.0584655 |
| Decile 3 | 0.057132 |
| Decile 2 | 0.055497 |
| Decile 1 | 0.0535155 |
| Minimum | 0.046557 |
|
|
- Mean = 0.0608362
- Std.dev = 0.0115206
- 15 items above graph maximum of 0.0832975
|
Notes
Mean OD (orientation dispersion index) in genu of corpus callosum on FA (fractional anisotropy) skeleton (from dMRI data)
0 Related Data-Fields
There are no related data-fields
2 Applications
| Application ID | Title |
|---|
| 17689 | Genetic, environmental and lifestyle predictors of brain/cognitive-related outcomes. |
| 22783 | The joint analysis of imaging data and genetic data for early tumor detection, prevention, diagnosis and treatment |

