Data
83,906 items of data are available, covering 79,379 participants.
Defined-instances run from 2 to 3, labelled using Instancing
2.
Units of measurement are AU.
| Maximum | 1 |
| Decile 9 | 0.432137 |
| Decile 8 | 0.253282 |
| Decile 7 | 0.166693 |
| Decile 6 | 0.126496 |
| Median | 0.104505 |
| Decile 4 | 0.090187 |
| Decile 3 | 0.0801505 |
| Decile 2 | 0.0728495 |
| Decile 1 | 0.0663945 |
| Minimum | 0.046266 |
|

|
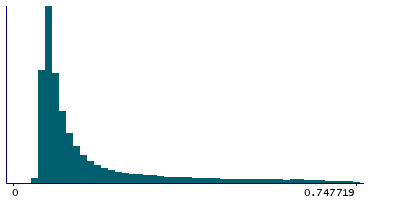
- Mean = 0.178199
- Std.dev = 0.164962
- 477 items above graph maximum of 0.797879
|
2 Instances
Instance 2 : Imaging visit (2014+)
79,148 participants, 79,148 items
| Maximum | 1 |
| Decile 9 | 0.434458 |
| Decile 8 | 0.25541 |
| Decile 7 | 0.167678 |
| Decile 6 | 0.127001 |
| Median | 0.104821 |
| Decile 4 | 0.0903595 |
| Decile 3 | 0.0802125 |
| Decile 2 | 0.072863 |
| Decile 1 | 0.066394 |
| Minimum | 0.046266 |
|
|
- Mean = 0.178905
- Std.dev = 0.165593
- 448 items above graph maximum of 0.802522
|
Instance 3 : First repeat imaging visit (2019+)
4,758 participants, 4,758 items
| Maximum | 0.975327 |
| Decile 9 | 0.397197 |
| Decile 8 | 0.220858 |
| Decile 7 | 0.150904 |
| Decile 6 | 0.118555 |
| Median | 0.100308 |
| Decile 4 | 0.0876915 |
| Decile 3 | 0.079123 |
| Decile 2 | 0.072488 |
| Decile 1 | 0.066415 |
| Minimum | 0.049341 |
|

|
- Mean = 0.166446
- Std.dev = 0.153602
- 49 items above graph maximum of 0.727979
|
Notes
Mean OD (orientation dispersion index) in fornix on FA (fractional anisotropy) skeleton (from dMRI data)
0 Related Data-Fields
There are no related data-fields
2 Applications
| Application ID | Title |
|---|
| 17689 | Genetic, environmental and lifestyle predictors of brain/cognitive-related outcomes. |
| 22783 | The joint analysis of imaging data and genetic data for early tumor detection, prevention, diagnosis and treatment |

