Data
83,906 items of data are available, covering 79,379 participants.
Defined-instances run from 2 to 3, labelled using Instancing
2.
Units of measurement are AU.
| Maximum | 0.556722 |
| Decile 9 | 0.116576 |
| Decile 8 | 0.109749 |
| Decile 7 | 0.105181 |
| Decile 6 | 0.101507 |
| Median | 0.098161 |
| Decile 4 | 0.095062 |
| Decile 3 | 0.091885 |
| Decile 2 | 0.0883295 |
| Decile 1 | 0.0837365 |
| Minimum | 0 |
|
|
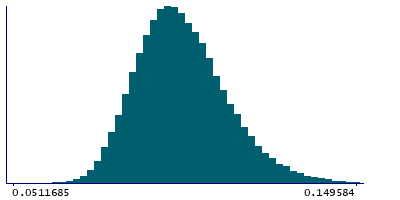
- Mean = 0.0994953
- Std.dev = 0.0138505
- 3 items below graph minimum of 0.0508965
- 216 items above graph maximum of 0.149417
|
2 Instances
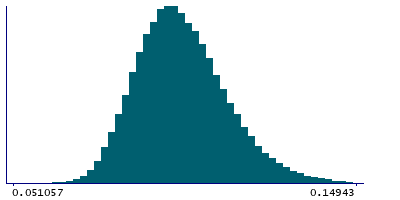
Instance 2 : Imaging visit (2014+)
79,148 participants, 79,148 items
| Maximum | 0.556722 |
| Decile 9 | 0.116457 |
| Decile 8 | 0.109671 |
| Decile 7 | 0.105074 |
| Decile 6 | 0.101404 |
| Median | 0.098071 |
| Decile 4 | 0.09498 |
| Decile 3 | 0.0918035 |
| Decile 2 | 0.0882315 |
| Decile 1 | 0.0836405 |
| Minimum | 0 |
|
|
- Mean = 0.0993989
- Std.dev = 0.0138366
- 3 items below graph minimum of 0.050824
- 203 items above graph maximum of 0.149274
|
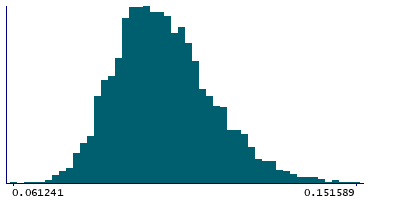
Instance 3 : First repeat imaging visit (2019+)
4,758 participants, 4,758 items
| Maximum | 0.389437 |
| Decile 9 | 0.118416 |
| Decile 8 | 0.111273 |
| Decile 7 | 0.106672 |
| Decile 6 | 0.10299 |
| Median | 0.099784 |
| Decile 4 | 0.0964675 |
| Decile 3 | 0.093349 |
| Decile 2 | 0.090114 |
| Decile 1 | 0.0852105 |
| Minimum | 0.061241 |
|
|
- Mean = 0.1011
- Std.dev = 0.0139826
- 11 items above graph maximum of 0.151621
|
Notes
Mean OD (orientation dispersion index) in sagittal stratum (right) on FA (fractional anisotropy) skeleton (from dMRI data)
0 Related Data-Fields
There are no related data-fields
2 Applications
| Application ID | Title |
|---|
| 17689 | Genetic, environmental and lifestyle predictors of brain/cognitive-related outcomes. |
| 22783 | The joint analysis of imaging data and genetic data for early tumor detection, prevention, diagnosis and treatment |

