Data
83,906 items of data are available, covering 79,379 participants.
Defined-instances run from 2 to 3, labelled using Instancing
2.
Units of measurement are AU.
| Maximum | 0.60088 |
| Decile 9 | 0.121807 |
| Decile 8 | 0.114384 |
| Decile 7 | 0.109471 |
| Decile 6 | 0.10554 |
| Median | 0.102141 |
| Decile 4 | 0.0988275 |
| Decile 3 | 0.095429 |
| Decile 2 | 0.091727 |
| Decile 1 | 0.086851 |
| Minimum | 0 |
|
|
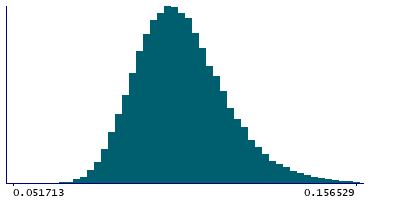
- Mean = 0.103616
- Std.dev = 0.0149658
- 3 items below graph minimum of 0.051895
- 292 items above graph maximum of 0.156763
|
2 Instances
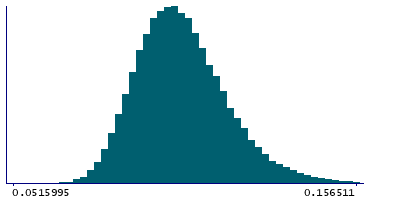
Instance 2 : Imaging visit (2014+)
79,148 participants, 79,148 items
| Maximum | 0.60088 |
| Decile 9 | 0.121802 |
| Decile 8 | 0.114362 |
| Decile 7 | 0.109445 |
| Decile 6 | 0.105494 |
| Median | 0.102085 |
| Decile 4 | 0.098759 |
| Decile 3 | 0.0953665 |
| Decile 2 | 0.091655 |
| Decile 1 | 0.0867885 |
| Minimum | 0 |
|
|
- Mean = 0.103574
- Std.dev = 0.0149787
- 3 items below graph minimum of 0.051775
- 275 items above graph maximum of 0.156815
|
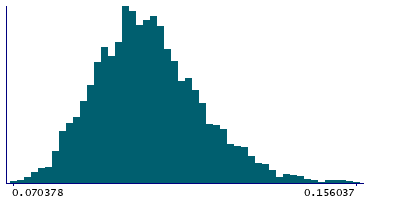
Instance 3 : First repeat imaging visit (2019+)
4,758 participants, 4,758 items
| Maximum | 0.430789 |
| Decile 9 | 0.121971 |
| Decile 8 | 0.114801 |
| Decile 7 | 0.109926 |
| Decile 6 | 0.106289 |
| Median | 0.103147 |
| Decile 4 | 0.09982 |
| Decile 3 | 0.0967455 |
| Decile 2 | 0.092717 |
| Decile 1 | 0.087855 |
| Minimum | 0.070378 |
|
|
- Mean = 0.104325
- Std.dev = 0.0147322
- 15 items above graph maximum of 0.156086
|
Notes
Mean OD (orientation dispersion index) in sagittal stratum (left) on FA (fractional anisotropy) skeleton (from dMRI data)
0 Related Data-Fields
There are no related data-fields
2 Applications
| Application ID | Title |
|---|
| 17689 | Genetic, environmental and lifestyle predictors of brain/cognitive-related outcomes. |
| 22783 | The joint analysis of imaging data and genetic data for early tumor detection, prevention, diagnosis and treatment |

