Data
83,906 items of data are available, covering 79,379 participants.
Defined-instances run from 2 to 3, labelled using Instancing
2.
Units of measurement are AU.
| Maximum | 0.995777 |
| Decile 9 | 0.222276 |
| Decile 8 | 0.209241 |
| Decile 7 | 0.199601 |
| Decile 6 | 0.191441 |
| Median | 0.183793 |
| Decile 4 | 0.176121 |
| Decile 3 | 0.168026 |
| Decile 2 | 0.158762 |
| Decile 1 | 0.146445 |
| Minimum | 0.050122 |
|
|
- Mean = 0.184377
- Std.dev = 0.0305356
- 99 items above graph maximum of 0.298107
|
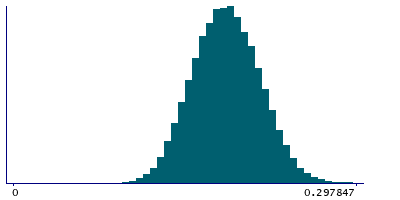
2 Instances
Instance 2 : Imaging visit (2014+)
79,148 participants, 79,148 items
| Maximum | 0.995777 |
| Decile 9 | 0.221996 |
| Decile 8 | 0.209041 |
| Decile 7 | 0.199433 |
| Decile 6 | 0.191269 |
| Median | 0.183611 |
| Decile 4 | 0.175938 |
| Decile 3 | 0.167827 |
| Decile 2 | 0.158545 |
| Decile 1 | 0.146282 |
| Minimum | 0.050122 |
|

|
- Mean = 0.184181
- Std.dev = 0.0304653
- 90 items above graph maximum of 0.29771
|
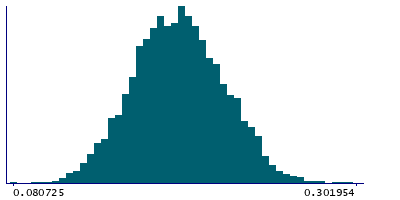
Instance 3 : First repeat imaging visit (2019+)
4,758 participants, 4,758 items
| Maximum | 0.594841 |
| Decile 9 | 0.225955 |
| Decile 8 | 0.212348 |
| Decile 7 | 0.202335 |
| Decile 6 | 0.194163 |
| Median | 0.186822 |
| Decile 4 | 0.178619 |
| Decile 3 | 0.171012 |
| Decile 2 | 0.162341 |
| Decile 1 | 0.149919 |
| Minimum | 0.080725 |
|
|
- Mean = 0.187638
- Std.dev = 0.0315047
- 10 items above graph maximum of 0.301992
|
Notes
Mean OD (orientation dispersion index) in superior fronto-occipital fasciculus (left) on FA (fractional anisotropy) skeleton (from dMRI data)
0 Related Data-Fields
There are no related data-fields
2 Applications
| Application ID | Title |
|---|
| 17689 | Genetic, environmental and lifestyle predictors of brain/cognitive-related outcomes. |
| 22783 | The joint analysis of imaging data and genetic data for early tumor detection, prevention, diagnosis and treatment |

