Data
83,906 items of data are available, covering 79,379 participants.
Defined-instances run from 2 to 3, labelled using Instancing
2.
Units of measurement are AU.
| Maximum | 0.567309 |
| Decile 9 | 0.175955 |
| Decile 8 | 0.164616 |
| Decile 7 | 0.156896 |
| Decile 6 | 0.15039 |
| Median | 0.144531 |
| Decile 4 | 0.138931 |
| Decile 3 | 0.133059 |
| Decile 2 | 0.126451 |
| Decile 1 | 0.11775 |
| Minimum | 0 |
|
|
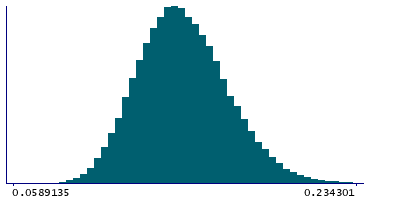
- Mean = 0.146037
- Std.dev = 0.023501
- 4 items below graph minimum of 0.0595455
- 104 items above graph maximum of 0.234159
|
2 Instances
Instance 2 : Imaging visit (2014+)
79,148 participants, 79,148 items
| Maximum | 0.567309 |
| Decile 9 | 0.175804 |
| Decile 8 | 0.164506 |
| Decile 7 | 0.156795 |
| Decile 6 | 0.150266 |
| Median | 0.144414 |
| Decile 4 | 0.138858 |
| Decile 3 | 0.132962 |
| Decile 2 | 0.126351 |
| Decile 1 | 0.117648 |
| Minimum | 0 |
|

|
- Mean = 0.145933
- Std.dev = 0.0234862
- 4 items below graph minimum of 0.0594915
- 97 items above graph maximum of 0.233959
|
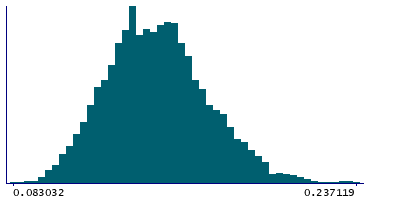
Instance 3 : First repeat imaging visit (2019+)
4,758 participants, 4,758 items
| Maximum | 0.456236 |
| Decile 9 | 0.178154 |
| Decile 8 | 0.166264 |
| Decile 7 | 0.158276 |
| Decile 6 | 0.152519 |
| Median | 0.146458 |
| Decile 4 | 0.14035 |
| Decile 3 | 0.134789 |
| Decile 2 | 0.128228 |
| Decile 1 | 0.119187 |
| Minimum | 0.083032 |
|
|
- Mean = 0.147775
- Std.dev = 0.0236776
- 3 items above graph maximum of 0.237121
|
Notes
Mean OD (orientation dispersion index) in uncinate fasciculus (left) on FA (fractional anisotropy) skeleton (from dMRI data)
0 Related Data-Fields
There are no related data-fields
2 Applications
| Application ID | Title |
|---|
| 17689 | Genetic, environmental and lifestyle predictors of brain/cognitive-related outcomes. |
| 22783 | The joint analysis of imaging data and genetic data for early tumor detection, prevention, diagnosis and treatment |

