Data
83,906 items of data are available, covering 79,379 participants.
Defined-instances run from 2 to 3, labelled using Instancing
2.
Units of measurement are AU.
| Maximum | 0.991693 |
| Decile 9 | 0.302442 |
| Decile 8 | 0.253449 |
| Decile 7 | 0.222718 |
| Decile 6 | 0.199302 |
| Median | 0.179522 |
| Decile 4 | 0.161691 |
| Decile 3 | 0.144257 |
| Decile 2 | 0.125829 |
| Decile 1 | 0.10419 |
| Minimum | 0 |
|

|
- Mean = 0.194324
- Std.dev = 0.0832588
- 423 items above graph maximum of 0.500693
|
2 Instances
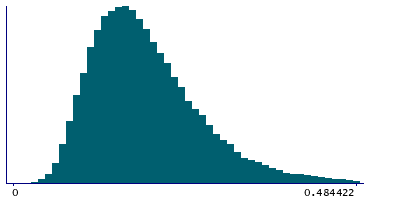
Instance 2 : Imaging visit (2014+)
79,148 participants, 79,148 items
| Maximum | 0.991693 |
| Decile 9 | 0.303692 |
| Decile 8 | 0.254798 |
| Decile 7 | 0.223774 |
| Decile 6 | 0.200164 |
| Median | 0.180382 |
| Decile 4 | 0.162493 |
| Decile 3 | 0.145035 |
| Decile 2 | 0.126568 |
| Decile 1 | 0.104824 |
| Minimum | 0 |
|
|
- Mean = 0.195258
- Std.dev = 0.0834736
- 393 items above graph maximum of 0.50256
|
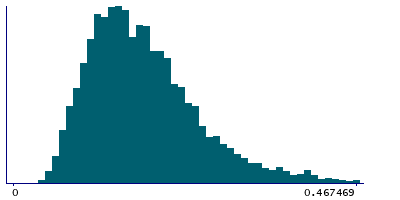
Instance 3 : First repeat imaging visit (2019+)
4,758 participants, 4,758 items
| Maximum | 0.678083 |
| Decile 9 | 0.280384 |
| Decile 8 | 0.232886 |
| Decile 7 | 0.205624 |
| Decile 6 | 0.183984 |
| Median | 0.16572 |
| Decile 4 | 0.147792 |
| Decile 3 | 0.131043 |
| Decile 2 | 0.113945 |
| Decile 1 | 0.0933965 |
| Minimum | 0.035259 |
|
|
- Mean = 0.178787
- Std.dev = 0.0779762
- 23 items above graph maximum of 0.467371
|
Notes
Mean ISOVF (isotropic or free water volume fraction) in tapetum (right) on FA (fractional anisotropy) skeleton (from dMRI data)
0 Related Data-Fields
There are no related data-fields
2 Applications
| Application ID | Title |
|---|
| 17689 | Genetic, environmental and lifestyle predictors of brain/cognitive-related outcomes. |
| 22783 | The joint analysis of imaging data and genetic data for early tumor detection, prevention, diagnosis and treatment |

