Data
83,906 items of data are available, covering 79,379 participants.
Defined-instances run from 2 to 3, labelled using Instancing
2.
Units of measurement are AU.
| Maximum | 0.998509 |
| Decile 9 | 0.27556 |
| Decile 8 | 0.222865 |
| Decile 7 | 0.189936 |
| Decile 6 | 0.16527 |
| Median | 0.144648 |
| Decile 4 | 0.126611 |
| Decile 3 | 0.109576 |
| Decile 2 | 0.0925235 |
| Decile 1 | 0.0718685 |
| Minimum | 0 |
|
|
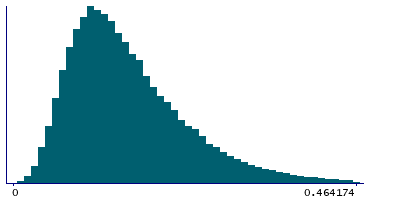
- Mean = 0.162359
- Std.dev = 0.0858186
- 474 items above graph maximum of 0.479252
|
2 Instances
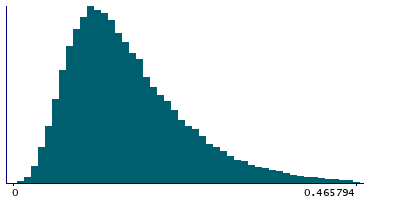
Instance 2 : Imaging visit (2014+)
79,148 participants, 79,148 items
| Maximum | 0.998509 |
| Decile 9 | 0.276895 |
| Decile 8 | 0.223955 |
| Decile 7 | 0.190956 |
| Decile 6 | 0.1661 |
| Median | 0.145413 |
| Decile 4 | 0.127352 |
| Decile 3 | 0.110291 |
| Decile 2 | 0.0930935 |
| Decile 1 | 0.0723885 |
| Minimum | 0 |
|
|
- Mean = 0.163248
- Std.dev = 0.0861802
- 441 items above graph maximum of 0.481402
|
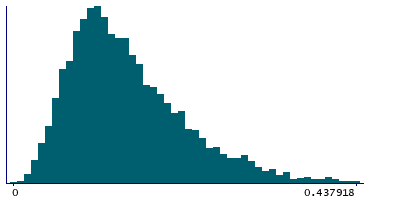
Instance 3 : First repeat imaging visit (2019+)
4,758 participants, 4,758 items
| Maximum | 0.673342 |
| Decile 9 | 0.251624 |
| Decile 8 | 0.203937 |
| Decile 7 | 0.173667 |
| Decile 6 | 0.150492 |
| Median | 0.131741 |
| Decile 4 | 0.114859 |
| Decile 3 | 0.099688 |
| Decile 2 | 0.0841095 |
| Decile 1 | 0.064499 |
| Minimum | 0.001664 |
|
|
- Mean = 0.147562
- Std.dev = 0.0780891
- 25 items above graph maximum of 0.438749
|
Notes
Mean ISOVF (isotropic or free water volume fraction) in tapetum (left) on FA (fractional anisotropy) skeleton (from dMRI data)
0 Related Data-Fields
There are no related data-fields
2 Applications
| Application ID | Title |
|---|
| 17689 | Genetic, environmental and lifestyle predictors of brain/cognitive-related outcomes. |
| 22783 | The joint analysis of imaging data and genetic data for early tumor detection, prevention, diagnosis and treatment |

