Data
83,909 items of data are available, covering 79,382 participants.
Defined-instances run from 2 to 3, labelled using Instancing
2.
Units of measurement are AU.
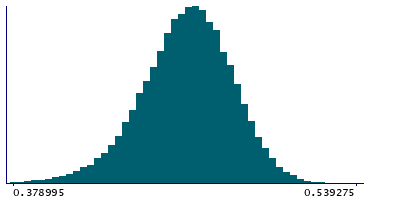
| Maximum | 0.540529 |
| Decile 9 | 0.485454 |
| Decile 8 | 0.477037 |
| Decile 7 | 0.470798 |
| Decile 6 | 0.465391 |
| Median | 0.460203 |
| Decile 4 | 0.454841 |
| Decile 3 | 0.449015 |
| Decile 2 | 0.441651 |
| Decile 1 | 0.431081 |
| Minimum | 0 |
|
|
- Mean = 0.458813
- Std.dev = 0.0226601
- 172 items below graph minimum of 0.376707
- 1 item above graph maximum of 0.539828
|
2 Instances
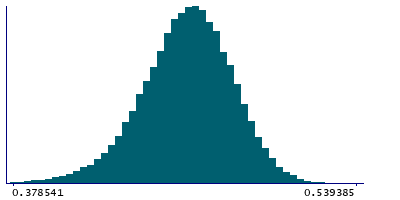
Instance 2 : Imaging visit (2014+)
79,151 participants, 79,151 items
| Maximum | 0.540529 |
| Decile 9 | 0.485346 |
| Decile 8 | 0.476932 |
| Decile 7 | 0.470668 |
| Decile 6 | 0.465242 |
| Median | 0.460043 |
| Decile 4 | 0.454669 |
| Decile 3 | 0.448837 |
| Decile 2 | 0.441446 |
| Decile 1 | 0.430798 |
| Minimum | 0 |
|
|
- Mean = 0.458641
- Std.dev = 0.022776
- 168 items below graph minimum of 0.37625
- 1 item above graph maximum of 0.539894
|
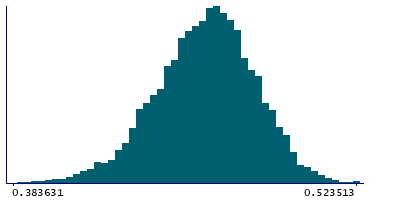
Instance 3 : First repeat imaging visit (2019+)
4,758 participants, 4,758 items
| Maximum | 0.523513 |
| Decile 9 | 0.487025 |
| Decile 8 | 0.478705 |
| Decile 7 | 0.472808 |
| Decile 6 | 0.467597 |
| Median | 0.462977 |
| Decile 4 | 0.457534 |
| Decile 3 | 0.452028 |
| Decile 2 | 0.445213 |
| Decile 1 | 0.435317 |
| Minimum | 0.3568 |
|
|
- Mean = 0.461683
- Std.dev = 0.0204226
- 6 items below graph minimum of 0.383608
|
Notes
Weighted-mean FA (fractional anisotropy) in tract left inferior longitudinal fasciculus (from dMRI data)
0 Related Data-Fields
There are no related data-fields
2 Applications
| Application ID | Title |
|---|
| 17689 | Genetic, environmental and lifestyle predictors of brain/cognitive-related outcomes. |
| 22783 | The joint analysis of imaging data and genetic data for early tumor detection, prevention, diagnosis and treatment |

