Data
83,909 items of data are available, covering 79,382 participants.
Defined-instances run from 2 to 3, labelled using Instancing
2.
Units of measurement are AU.
| Maximum | 0.630395 |
| Decile 9 | 0.45833 |
| Decile 8 | 0.447192 |
| Decile 7 | 0.439481 |
| Decile 6 | 0.432845 |
| Median | 0.426743 |
| Decile 4 | 0.420671 |
| Decile 3 | 0.414053 |
| Decile 2 | 0.40636 |
| Decile 1 | 0.395401 |
| Minimum | 0 |
|

|
- Mean = 0.426796
- Std.dev = 0.0253234
- 46 items below graph minimum of 0.332471
- 42 items above graph maximum of 0.52126
|
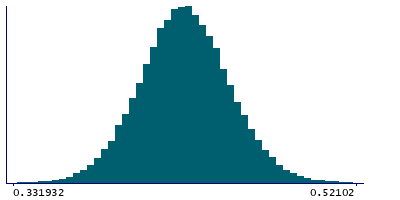
2 Instances
Instance 2 : Imaging visit (2014+)
79,151 participants, 79,151 items
| Maximum | 0.630395 |
| Decile 9 | 0.458068 |
| Decile 8 | 0.446896 |
| Decile 7 | 0.439153 |
| Decile 6 | 0.4325 |
| Median | 0.426434 |
| Decile 4 | 0.420338 |
| Decile 3 | 0.413731 |
| Decile 2 | 0.406001 |
| Decile 1 | 0.395058 |
| Minimum | 0 |
|
|
- Mean = 0.426489
- Std.dev = 0.025317
- 40 items below graph minimum of 0.332049
- 38 items above graph maximum of 0.521077
|
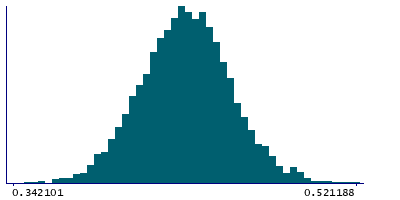
Instance 3 : First repeat imaging visit (2019+)
4,758 participants, 4,758 items
| Maximum | 0.590423 |
| Decile 9 | 0.461493 |
| Decile 8 | 0.451209 |
| Decile 7 | 0.444121 |
| Decile 6 | 0.438226 |
| Median | 0.432102 |
| Decile 4 | 0.426327 |
| Decile 3 | 0.419927 |
| Decile 2 | 0.412597 |
| Decile 1 | 0.401786 |
| Minimum | 0 |
|
|
- Mean = 0.431907
- Std.dev = 0.0248786
- 7 items below graph minimum of 0.342079
- 4 items above graph maximum of 0.5212
|
Notes
Weighted-mean FA (fractional anisotropy) in tract left medial lemniscus (from dMRI data)
0 Related Data-Fields
There are no related data-fields
2 Applications
| Application ID | Title |
|---|
| 17689 | Genetic, environmental and lifestyle predictors of brain/cognitive-related outcomes. |
| 22783 | The joint analysis of imaging data and genetic data for early tumor detection, prevention, diagnosis and treatment |

