Data
83,909 items of data are available, covering 79,382 participants.
Defined-instances run from 2 to 3, labelled using Instancing
2.
Units of measurement are AU.
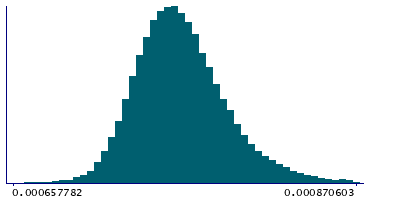
| Maximum | 0.00148787 |
| Decile 9 | 0.000800432 |
| Decile 8 | 0.000784268 |
| Decile 7 | 0.000773917 |
| Decile 6 | 0.000765975 |
| Median | 0.000758957 |
| Decile 4 | 0.000752253 |
| Decile 3 | 0.000745459 |
| Decile 2 | 0.000737867 |
| Decile 1 | 0.000727899 |
| Minimum | 0 |
|

|
- Mean = 0.000762296
- Std.dev = 3.22861e-05
- 55 items below graph minimum of 0.000655365
- 480 items above graph maximum of 0.000872965
|
2 Instances
Instance 2 : Imaging visit (2014+)
79,151 participants, 79,151 items
| Maximum | 0.0012411 |
| Decile 9 | 0.000800645 |
| Decile 8 | 0.000784402 |
| Decile 7 | 0.000774028 |
| Decile 6 | 0.000766052 |
| Median | 0.000758977 |
| Decile 4 | 0.000752223 |
| Decile 3 | 0.000745413 |
| Decile 2 | 0.00073776 |
| Decile 1 | 0.000727769 |
| Minimum | 0 |
|
|
- Mean = 0.000762306
- Std.dev = 3.23798e-05
- 51 items below graph minimum of 0.000654893
- 459 items above graph maximum of 0.000873521
|
Instance 3 : First repeat imaging visit (2019+)
4,758 participants, 4,758 items
| Maximum | 0.00148787 |
| Decile 9 | 0.000796605 |
| Decile 8 | 0.000782108 |
| Decile 7 | 0.000772209 |
| Decile 6 | 0.000764837 |
| Median | 0.000758496 |
| Decile 4 | 0.000752759 |
| Decile 3 | 0.000746234 |
| Decile 2 | 0.000739478 |
| Decile 1 | 0.000730314 |
| Minimum | 0.000646321 |
|

|
- Mean = 0.000762131
- Std.dev = 3.06847e-05
- 1 item below graph minimum of 0.000664024
- 27 items above graph maximum of 0.000862896
|
Notes
Weighted-mean MD (mean diffusivity) in tract left superior thalamic radiation (from dMRI data)
0 Related Data-Fields
There are no related data-fields
2 Applications
| Application ID | Title |
|---|
| 17689 | Genetic, environmental and lifestyle predictors of brain/cognitive-related outcomes. |
| 22783 | The joint analysis of imaging data and genetic data for early tumor detection, prevention, diagnosis and treatment |

