Data
83,909 items of data are available, covering 79,382 participants.
Defined-instances run from 2 to 3, labelled using Instancing
2.
Units of measurement are AU.
| Maximum | 0.832986 |
| Decile 9 | 0.706548 |
| Decile 8 | 0.684326 |
| Decile 7 | 0.666606 |
| Decile 6 | 0.650989 |
| Median | 0.635417 |
| Decile 4 | 0.618383 |
| Decile 3 | 0.599617 |
| Decile 2 | 0.575525 |
| Decile 1 | 0.539084 |
| Minimum | 0 |
|
|
- Mean = 0.6276
- Std.dev = 0.0676351
- 177 items below graph minimum of 0.371619
|
2 Instances
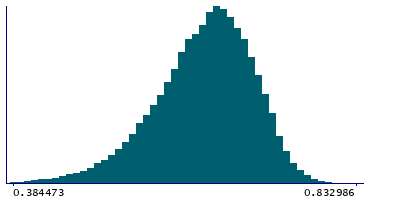
Instance 2 : Imaging visit (2014+)
79,151 participants, 79,151 items
| Maximum | 0.832986 |
| Decile 9 | 0.706134 |
| Decile 8 | 0.683879 |
| Decile 7 | 0.666091 |
| Decile 6 | 0.650487 |
| Median | 0.634875 |
| Decile 4 | 0.617626 |
| Decile 3 | 0.598822 |
| Decile 2 | 0.574778 |
| Decile 1 | 0.538382 |
| Minimum | 0 |
|

|
- Mean = 0.627026
- Std.dev = 0.0677245
- 168 items below graph minimum of 0.370629
|
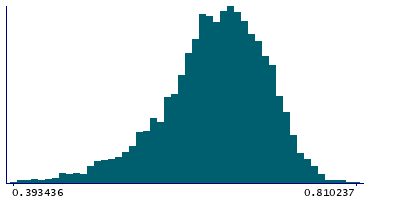
Instance 3 : First repeat imaging visit (2019+)
4,758 participants, 4,758 items
| Maximum | 0.810237 |
| Decile 9 | 0.711864 |
| Decile 8 | 0.691003 |
| Decile 7 | 0.673918 |
| Decile 6 | 0.658809 |
| Median | 0.644244 |
| Decile 4 | 0.628655 |
| Decile 3 | 0.611791 |
| Decile 2 | 0.589488 |
| Decile 1 | 0.55253 |
| Minimum | 0 |
|
|
- Mean = 0.637146
- Std.dev = 0.0653946
- 4 items below graph minimum of 0.393197
|
Notes
Weighted-mean MO (diffusion tensor mode) in tract left cingulate gyrus part of cingulum (from dMRI data)
0 Related Data-Fields
There are no related data-fields
2 Applications
| Application ID | Title |
|---|
| 17689 | Genetic, environmental and lifestyle predictors of brain/cognitive-related outcomes. |
| 22783 | The joint analysis of imaging data and genetic data for early tumor detection, prevention, diagnosis and treatment |

