Data
83,909 items of data are available, covering 79,382 participants.
Defined-instances run from 2 to 3, labelled using Instancing
2.
Units of measurement are AU.
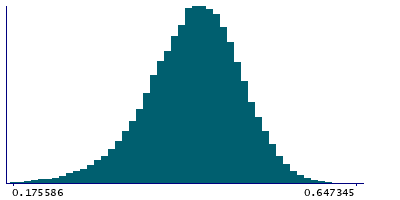
| Maximum | 0.647345 |
| Decile 9 | 0.502249 |
| Decile 8 | 0.477173 |
| Decile 7 | 0.459115 |
| Decile 6 | 0.44319 |
| Median | 0.427641 |
| Decile 4 | 0.412008 |
| Decile 3 | 0.394006 |
| Decile 2 | 0.372224 |
| Decile 1 | 0.339799 |
| Minimum | 0 |
|
|
- Mean = 0.423337
- Std.dev = 0.065319
- 144 items below graph minimum of 0.17735
|
2 Instances
Instance 2 : Imaging visit (2014+)
79,151 participants, 79,151 items
| Maximum | 0.647345 |
| Decile 9 | 0.502558 |
| Decile 8 | 0.477473 |
| Decile 7 | 0.459427 |
| Decile 6 | 0.443511 |
| Median | 0.427969 |
| Decile 4 | 0.412347 |
| Decile 3 | 0.394411 |
| Decile 2 | 0.37251 |
| Decile 1 | 0.340098 |
| Minimum | 0 |
|

|
- Mean = 0.423632
- Std.dev = 0.0653085
- 136 items below graph minimum of 0.177638
|
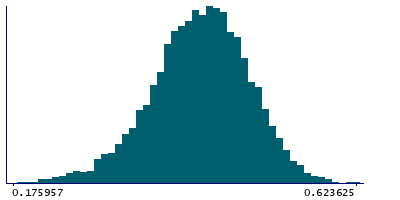
Instance 3 : First repeat imaging visit (2019+)
4,758 participants, 4,758 items
| Maximum | 0.623625 |
| Decile 9 | 0.4979 |
| Decile 8 | 0.4723 |
| Decile 7 | 0.453744 |
| Decile 6 | 0.437675 |
| Median | 0.421701 |
| Decile 4 | 0.405482 |
| Decile 3 | 0.388139 |
| Decile 2 | 0.36878 |
| Decile 1 | 0.336961 |
| Minimum | 0 |
|
|
- Mean = 0.418436
- Std.dev = 0.065299
- 10 items below graph minimum of 0.176023
|
Notes
Weighted-mean MO (diffusion tensor mode) in tract left parahippocampal part of cingulum (from dMRI data)
0 Related Data-Fields
There are no related data-fields
2 Applications
| Application ID | Title |
|---|
| 17689 | Genetic, environmental and lifestyle predictors of brain/cognitive-related outcomes. |
| 22783 | The joint analysis of imaging data and genetic data for early tumor detection, prevention, diagnosis and treatment |

