Data
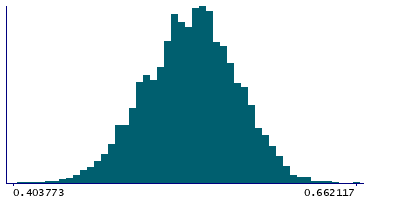
83,909 items of data are available, covering 79,382 participants.
Defined-instances run from 2 to 3, labelled using Instancing
2.
Units of measurement are AU.
| Maximum | 0.666648 |
| Decile 9 | 0.582392 |
| Decile 8 | 0.567417 |
| Decile 7 | 0.556725 |
| Decile 6 | 0.547559 |
| Median | 0.538567 |
| Decile 4 | 0.529298 |
| Decile 3 | 0.519454 |
| Decile 2 | 0.507715 |
| Decile 1 | 0.491153 |
| Minimum | -0.0626209 |
|
|
- Mean = 0.537186
- Std.dev = 0.037038
- 83 items below graph minimum of 0.399914
|
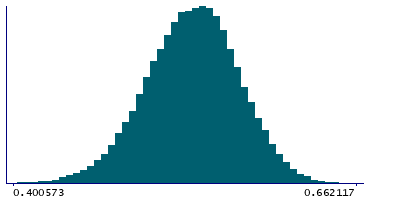
2 Instances
Instance 2 : Imaging visit (2014+)
79,151 participants, 79,151 items
| Maximum | 0.666648 |
| Decile 9 | 0.582515 |
| Decile 8 | 0.567492 |
| Decile 7 | 0.556783 |
| Decile 6 | 0.547614 |
| Median | 0.538568 |
| Decile 4 | 0.529322 |
| Decile 3 | 0.519389 |
| Decile 2 | 0.507742 |
| Decile 1 | 0.491065 |
| Minimum | -0.0626209 |
|
|
- Mean = 0.537199
- Std.dev = 0.0370903
- 79 items below graph minimum of 0.399615
|
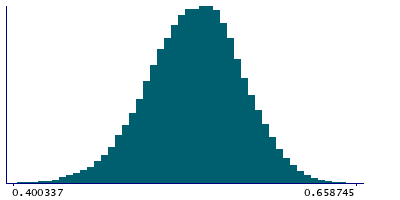
Instance 3 : First repeat imaging visit (2019+)
4,758 participants, 4,758 items
| Maximum | 0.662117 |
| Decile 9 | 0.580948 |
| Decile 8 | 0.566384 |
| Decile 7 | 0.55543 |
| Decile 6 | 0.546849 |
| Median | 0.538568 |
| Decile 4 | 0.52906 |
| Decile 3 | 0.520249 |
| Decile 2 | 0.507172 |
| Decile 1 | 0.492352 |
| Minimum | 0 |
|
|
- Mean = 0.536973
- Std.dev = 0.0361555
- 4 items below graph minimum of 0.403756
|
Notes
Weighted-mean MO (diffusion tensor mode) in tract right inferior fronto-occipital fasciculus (from dMRI data)
0 Related Data-Fields
There are no related data-fields
2 Applications
| Application ID | Title |
|---|
| 17689 | Genetic, environmental and lifestyle predictors of brain/cognitive-related outcomes. |
| 22783 | The joint analysis of imaging data and genetic data for early tumor detection, prevention, diagnosis and treatment |

