Data
83,909 items of data are available, covering 79,382 participants.
Defined-instances run from 2 to 3, labelled using Instancing
2.
Units of measurement are AU.
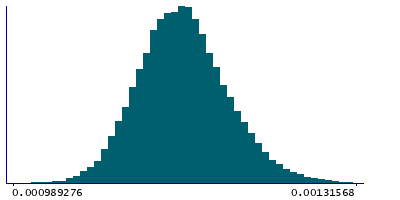
| Maximum | 0.0017724 |
| Decile 9 | 0.00120573 |
| Decile 8 | 0.00118427 |
| Decile 7 | 0.00116992 |
| Decile 6 | 0.00115831 |
| Median | 0.00114808 |
| Decile 4 | 0.00113758 |
| Decile 3 | 0.00112688 |
| Decile 2 | 0.00111458 |
| Decile 1 | 0.00109769 |
| Minimum | 0 |
|
|
- Mean = 0.00114992
- Std.dev = 4.85092e-05
- 36 items below graph minimum of 0.000989651
- 163 items above graph maximum of 0.00131377
|
2 Instances
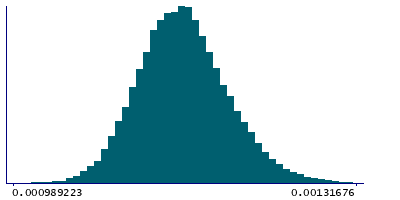
Instance 2 : Imaging visit (2014+)
79,151 participants, 79,151 items
| Maximum | 0.0017724 |
| Decile 9 | 0.00120621 |
| Decile 8 | 0.00118476 |
| Decile 7 | 0.00117029 |
| Decile 6 | 0.0011586 |
| Median | 0.00114838 |
| Decile 4 | 0.00113787 |
| Decile 3 | 0.0011272 |
| Decile 2 | 0.00111486 |
| Decile 1 | 0.0010979 |
| Minimum | 0 |
|
|
- Mean = 0.00115028
- Std.dev = 4.83954e-05
- 32 items below graph minimum of 0.000989597
- 155 items above graph maximum of 0.00131452
|
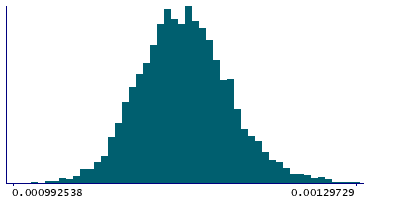
Instance 3 : First repeat imaging visit (2019+)
4,758 participants, 4,758 items
| Maximum | 0.00142645 |
| Decile 9 | 0.00119574 |
| Decile 8 | 0.00117708 |
| Decile 7 | 0.00116389 |
| Decile 6 | 0.00115326 |
| Median | 0.00114349 |
| Decile 4 | 0.00113272 |
| Decile 3 | 0.00112278 |
| Decile 2 | 0.00111023 |
| Decile 1 | 0.00109415 |
| Minimum | 0 |
|
|
- Mean = 0.00114395
- Std.dev = 4.99882e-05
- 4 items below graph minimum of 0.000992556
- 7 items above graph maximum of 0.00129733
|
Notes
Weighted-mean L1 in tract right acoustic radiation (from dMRI data)
0 Related Data-Fields
There are no related data-fields
2 Applications
| Application ID | Title |
|---|
| 17689 | Genetic, environmental and lifestyle predictors of brain/cognitive-related outcomes. |
| 22783 | The joint analysis of imaging data and genetic data for early tumor detection, prevention, diagnosis and treatment |

