Data
83,909 items of data are available, covering 79,382 participants.
Defined-instances run from 2 to 3, labelled using Instancing
2.
Units of measurement are AU.
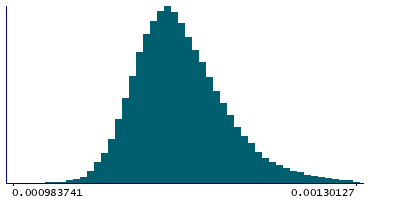
| Maximum | 0.00159249 |
| Decile 9 | 0.00120113 |
| Decile 8 | 0.00117617 |
| Decile 7 | 0.00116031 |
| Decile 6 | 0.00114774 |
| Median | 0.00113692 |
| Decile 4 | 0.00112701 |
| Decile 3 | 0.00111715 |
| Decile 2 | 0.00110606 |
| Decile 1 | 0.0010917 |
| Minimum | 0 |
|
|
- Mean = 0.00114249
- Std.dev = 4.913e-05
- 32 items below graph minimum of 0.000982278
- 300 items above graph maximum of 0.00131055
|
2 Instances
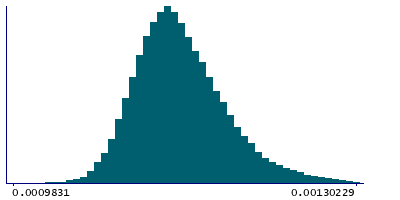
Instance 2 : Imaging visit (2014+)
79,151 participants, 79,151 items
| Maximum | 0.00159249 |
| Decile 9 | 0.00120186 |
| Decile 8 | 0.00117678 |
| Decile 7 | 0.00116079 |
| Decile 6 | 0.00114823 |
| Median | 0.00113732 |
| Decile 4 | 0.0011274 |
| Decile 3 | 0.0011175 |
| Decile 2 | 0.00110634 |
| Decile 1 | 0.00109178 |
| Minimum | 0 |
|
|
- Mean = 0.00114293
- Std.dev = 4.90734e-05
- 29 items below graph minimum of 0.000981703
- 282 items above graph maximum of 0.00131194
|
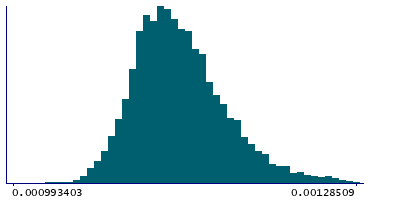
Instance 3 : First repeat imaging visit (2019+)
4,758 participants, 4,758 items
| Maximum | 0.00141822 |
| Decile 9 | 0.00118787 |
| Decile 8 | 0.0011661 |
| Decile 7 | 0.00115141 |
| Decile 6 | 0.00114044 |
| Median | 0.00113046 |
| Decile 4 | 0.00112132 |
| Decile 3 | 0.00111222 |
| Decile 2 | 0.00110295 |
| Decile 1 | 0.00109063 |
| Minimum | 0 |
|
|
- Mean = 0.00113513
- Std.dev = 4.94842e-05
- 3 items below graph minimum of 0.000993398
- 20 items above graph maximum of 0.0012851
|
Notes
Weighted-mean L1 in tract right anterior thalamic radiation (from dMRI data)
0 Related Data-Fields
There are no related data-fields
2 Applications
| Application ID | Title |
|---|
| 17689 | Genetic, environmental and lifestyle predictors of brain/cognitive-related outcomes. |
| 22783 | The joint analysis of imaging data and genetic data for early tumor detection, prevention, diagnosis and treatment |

