Data
83,909 items of data are available, covering 79,382 participants.
Defined-instances run from 2 to 3, labelled using Instancing
2.
Units of measurement are AU.
| Maximum | 0.00180289 |
| Decile 9 | 0.00135574 |
| Decile 8 | 0.00133816 |
| Decile 7 | 0.00132579 |
| Decile 6 | 0.00131518 |
| Median | 0.00130507 |
| Decile 4 | 0.00129505 |
| Decile 3 | 0.00128435 |
| Decile 2 | 0.00127178 |
| Decile 1 | 0.00125422 |
| Minimum | 0 |
|

|
- Mean = 0.00130477
- Std.dev = 4.63813e-05
- 38 items below graph minimum of 0.00115269
- 42 items above graph maximum of 0.00145726
|
2 Instances
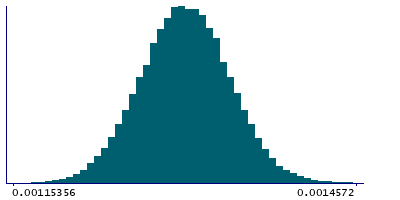
Instance 2 : Imaging visit (2014+)
79,151 participants, 79,151 items
| Maximum | 0.00180289 |
| Decile 9 | 0.001356 |
| Decile 8 | 0.00133838 |
| Decile 7 | 0.00132597 |
| Decile 6 | 0.0013154 |
| Median | 0.00130525 |
| Decile 4 | 0.00129521 |
| Decile 3 | 0.00128454 |
| Decile 2 | 0.00127188 |
| Decile 1 | 0.00125425 |
| Minimum | 0 |
|
|
- Mean = 0.00130496
- Std.dev = 4.61283e-05
- 35 items below graph minimum of 0.0011525
- 38 items above graph maximum of 0.00145775
|
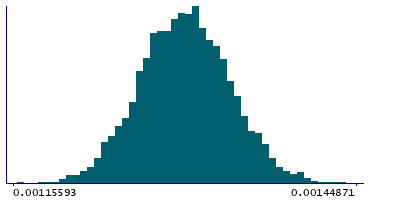
Instance 3 : First repeat imaging visit (2019+)
4,758 participants, 4,758 items
| Maximum | 0.00149881 |
| Decile 9 | 0.00135112 |
| Decile 8 | 0.00133441 |
| Decile 7 | 0.00132242 |
| Decile 6 | 0.00131193 |
| Median | 0.00130214 |
| Decile 4 | 0.00129212 |
| Decile 3 | 0.0012814 |
| Decile 2 | 0.00127027 |
| Decile 1 | 0.00125357 |
| Minimum | 0 |
|
|
- Mean = 0.00130159
- Std.dev = 5.02991e-05
- 3 items below graph minimum of 0.00115603
- 4 items above graph maximum of 0.00144866
|
Notes
Weighted-mean L1 in tract right corticospinal tract (from dMRI data)
0 Related Data-Fields
There are no related data-fields
2 Applications
| Application ID | Title |
|---|
| 17689 | Genetic, environmental and lifestyle predictors of brain/cognitive-related outcomes. |
| 22783 | The joint analysis of imaging data and genetic data for early tumor detection, prevention, diagnosis and treatment |

