Data
83,909 items of data are available, covering 79,382 participants.
Defined-instances run from 2 to 3, labelled using Instancing
2.
Units of measurement are AU.
| Maximum | 0.00283144 |
| Decile 9 | 0.00130954 |
| Decile 8 | 0.00126755 |
| Decile 7 | 0.00123533 |
| Decile 6 | 0.00120529 |
| Median | 0.00117375 |
| Decile 4 | 0.00114246 |
| Decile 3 | 0.00111391 |
| Decile 2 | 0.00108676 |
| Decile 1 | 0.00105683 |
| Minimum | 0 |
|

|
- Mean = 0.00117909
- Std.dev = 0.000102877
- 52 items below graph minimum of 0.000804117
- 60 items above graph maximum of 0.00156225
|
2 Instances
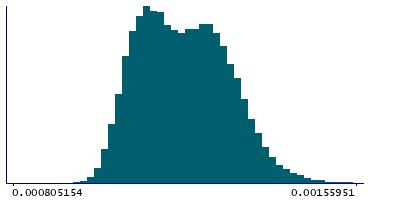
Instance 2 : Imaging visit (2014+)
79,151 participants, 79,151 items
| Maximum | 0.00283144 |
| Decile 9 | 0.00131071 |
| Decile 8 | 0.00126885 |
| Decile 7 | 0.00123674 |
| Decile 6 | 0.00120684 |
| Median | 0.00117517 |
| Decile 4 | 0.0011438 |
| Decile 3 | 0.00111525 |
| Decile 2 | 0.00108813 |
| Decile 1 | 0.00105787 |
| Minimum | 0 |
|
|
- Mean = 0.00118043
- Std.dev = 0.000102962
- 49 items below graph minimum of 0.000805039
- 58 items above graph maximum of 0.00156354
|
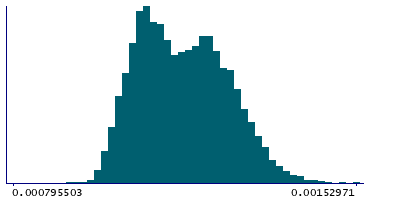
Instance 3 : First repeat imaging visit (2019+)
4,758 participants, 4,758 items
| Maximum | 0.00154255 |
| Decile 9 | 0.00128501 |
| Decile 8 | 0.00124461 |
| Decile 7 | 0.0012124 |
| Decile 6 | 0.00118324 |
| Median | 0.00115168 |
| Decile 4 | 0.00111954 |
| Decile 3 | 0.00109293 |
| Decile 2 | 0.00106892 |
| Decile 1 | 0.00104026 |
| Minimum | 0 |
|
|
- Mean = 0.00115692
- Std.dev = 9.8851e-05
- 3 items below graph minimum of 0.000795504
- 1 item above graph maximum of 0.00152976
|
Notes
Weighted-mean L1 in tract middle cerebellar peduncle (from dMRI data)
0 Related Data-Fields
There are no related data-fields
2 Applications
| Application ID | Title |
|---|
| 17689 | Genetic, environmental and lifestyle predictors of brain/cognitive-related outcomes. |
| 22783 | The joint analysis of imaging data and genetic data for early tumor detection, prevention, diagnosis and treatment |

