Data
83,909 items of data are available, covering 79,382 participants.
Defined-instances run from 2 to 3, labelled using Instancing
2.
Units of measurement are AU.
| Maximum | 0.00209153 |
| Decile 9 | 0.00118163 |
| Decile 8 | 0.00115915 |
| Decile 7 | 0.00114488 |
| Decile 6 | 0.00113374 |
| Median | 0.00112368 |
| Decile 4 | 0.00111432 |
| Decile 3 | 0.00110484 |
| Decile 2 | 0.00109433 |
| Decile 1 | 0.00108033 |
| Minimum | 0 |
|

|
- Mean = 0.00112801
- Std.dev = 4.46331e-05
- 55 items below graph minimum of 0.00097902
- 315 items above graph maximum of 0.00128294
|
2 Instances
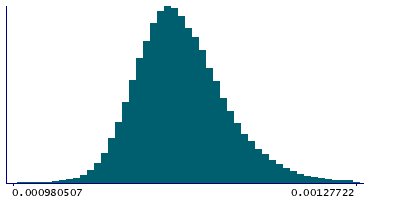
Instance 2 : Imaging visit (2014+)
79,151 participants, 79,151 items
| Maximum | 0.00209153 |
| Decile 9 | 0.00118205 |
| Decile 8 | 0.00115942 |
| Decile 7 | 0.00114515 |
| Decile 6 | 0.00113395 |
| Median | 0.00112385 |
| Decile 4 | 0.00111442 |
| Decile 3 | 0.00110489 |
| Decile 2 | 0.00109426 |
| Decile 1 | 0.00108019 |
| Minimum | 0 |
|
|
- Mean = 0.00112814
- Std.dev = 4.49133e-05
- 52 items below graph minimum of 0.00097832
- 296 items above graph maximum of 0.00128392
|
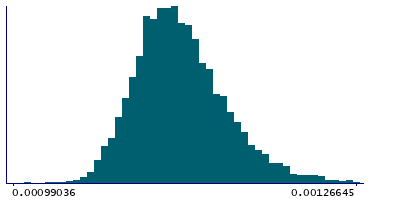
Instance 3 : First repeat imaging visit (2019+)
4,758 participants, 4,758 items
| Maximum | 0.00185442 |
| Decile 9 | 0.00117444 |
| Decile 8 | 0.00115388 |
| Decile 7 | 0.00114057 |
| Decile 6 | 0.00113043 |
| Median | 0.00112125 |
| Decile 4 | 0.00111275 |
| Decile 3 | 0.00110425 |
| Decile 2 | 0.00109532 |
| Decile 1 | 0.00108246 |
| Minimum | 0.000969238 |
|
|
- Mean = 0.00112593
- Std.dev = 3.96247e-05
- 1 item below graph minimum of 0.000990473
- 17 items above graph maximum of 0.00126643
|
Notes
Weighted-mean L1 in tract right superior thalamic radiation (from dMRI data)
0 Related Data-Fields
There are no related data-fields
2 Applications
| Application ID | Title |
|---|
| 17689 | Genetic, environmental and lifestyle predictors of brain/cognitive-related outcomes. |
| 22783 | The joint analysis of imaging data and genetic data for early tumor detection, prevention, diagnosis and treatment |

