Data
83,909 items of data are available, covering 79,382 participants.
Defined-instances run from 2 to 3, labelled using Instancing
2.
Units of measurement are AU.
| Maximum | 0.00141137 |
| Decile 9 | 0.000519193 |
| Decile 8 | 0.000503281 |
| Decile 7 | 0.000493244 |
| Decile 6 | 0.000485196 |
| Median | 0.000478178 |
| Decile 4 | 0.000471346 |
| Decile 3 | 0.00046435 |
| Decile 2 | 0.000456325 |
| Decile 1 | 0.000445395 |
| Minimum | 0 |
|
|
- Mean = 0.00048091
- Std.dev = 3.20339e-05
- 33 items below graph minimum of 0.000371598
- 419 items above graph maximum of 0.00059299
|
2 Instances
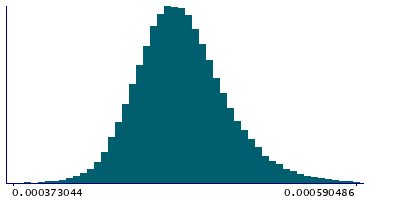
Instance 2 : Imaging visit (2014+)
79,151 participants, 79,151 items
| Maximum | 0.00141137 |
| Decile 9 | 0.000519396 |
| Decile 8 | 0.000503383 |
| Decile 7 | 0.000493324 |
| Decile 6 | 0.000485248 |
| Median | 0.00047817 |
| Decile 4 | 0.000471296 |
| Decile 3 | 0.000464266 |
| Decile 2 | 0.000456204 |
| Decile 1 | 0.000445229 |
| Minimum | 0 |
|

|
- Mean = 0.000480907
- Std.dev = 3.22101e-05
- 33 items below graph minimum of 0.000371062
- 394 items above graph maximum of 0.000593563
|
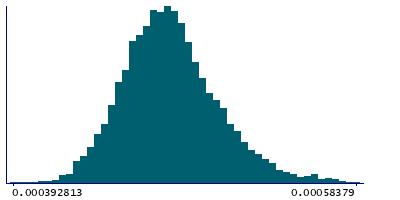
Instance 3 : First repeat imaging visit (2019+)
4,758 participants, 4,758 items
| Maximum | 0.0008049 |
| Decile 9 | 0.000516173 |
| Decile 8 | 0.000501554 |
| Decile 7 | 0.000491731 |
| Decile 6 | 0.000484578 |
| Median | 0.000478378 |
| Decile 4 | 0.000471991 |
| Decile 3 | 0.000465703 |
| Decile 2 | 0.000458454 |
| Decile 1 | 0.000448457 |
| Minimum | 0.000392813 |
|
|
- Mean = 0.000480954
- Std.dev = 2.89449e-05
- 21 items above graph maximum of 0.000583889
|
Notes
Weighted-mean L3 in tract right superior thalamic radiation (from dMRI data)
0 Related Data-Fields
There are no related data-fields
2 Applications
| Application ID | Title |
|---|
| 17689 | Genetic, environmental and lifestyle predictors of brain/cognitive-related outcomes. |
| 22783 | The joint analysis of imaging data and genetic data for early tumor detection, prevention, diagnosis and treatment |

