Data
83,905 items of data are available, covering 79,378 participants.
Defined-instances run from 2 to 3, labelled using Instancing
2.
Units of measurement are AU.
| Maximum | 0.372169 |
| Decile 9 | 0.15483 |
| Decile 8 | 0.145323 |
| Decile 7 | 0.139135 |
| Decile 6 | 0.134307 |
| Median | 0.129996 |
| Decile 4 | 0.125983 |
| Decile 3 | 0.121856 |
| Decile 2 | 0.117271 |
| Decile 1 | 0.111427 |
| Minimum | 0 |
|
|
- Mean = 0.131889
- Std.dev = 0.0177244
- 26 items below graph minimum of 0.0680244
- 209 items above graph maximum of 0.198232
|
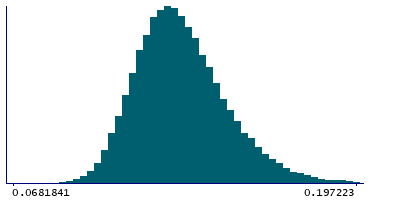
2 Instances
Instance 2 : Imaging visit (2014+)
79,147 participants, 79,147 items
| Maximum | 0.372169 |
| Decile 9 | 0.154921 |
| Decile 8 | 0.145392 |
| Decile 7 | 0.139197 |
| Decile 6 | 0.134336 |
| Median | 0.13003 |
| Decile 4 | 0.126003 |
| Decile 3 | 0.121876 |
| Decile 2 | 0.117272 |
| Decile 1 | 0.111434 |
| Minimum | 0 |
|

|
- Mean = 0.13193
- Std.dev = 0.0177557
- 23 items below graph minimum of 0.0679474
- 199 items above graph maximum of 0.198408
|
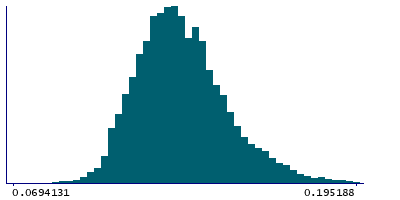
Instance 3 : First repeat imaging visit (2019+)
4,758 participants, 4,758 items
| Maximum | 0.224724 |
| Decile 9 | 0.15327 |
| Decile 8 | 0.144118 |
| Decile 7 | 0.138193 |
| Decile 6 | 0.133686 |
| Median | 0.129454 |
| Decile 4 | 0.125651 |
| Decile 3 | 0.12162 |
| Decile 2 | 0.117239 |
| Decile 1 | 0.111365 |
| Minimum | 0 |
|
|
- Mean = 0.131206
- Std.dev = 0.0171826
- 3 items below graph minimum of 0.0694592
- 10 items above graph maximum of 0.195176
|
Notes
Weighted-mean OD (orientation dispersion index) in tract left cingulate gyrus part of cingulum (from dMRI data)
0 Related Data-Fields
There are no related data-fields
2 Applications
| Application ID | Title |
|---|
| 17689 | Genetic, environmental and lifestyle predictors of brain/cognitive-related outcomes. |
| 22783 | The joint analysis of imaging data and genetic data for early tumor detection, prevention, diagnosis and treatment |

