Data
83,905 items of data are available, covering 79,378 participants.
Defined-instances run from 2 to 3, labelled using Instancing
2.
Units of measurement are AU.
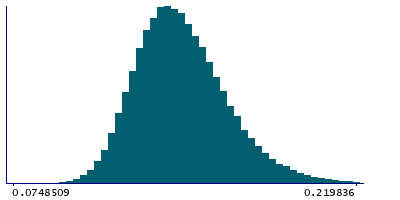
| Maximum | 0.410101 |
| Decile 9 | 0.172356 |
| Decile 8 | 0.161989 |
| Decile 7 | 0.155116 |
| Decile 6 | 0.149582 |
| Median | 0.144704 |
| Decile 4 | 0.140069 |
| Decile 3 | 0.135427 |
| Decile 2 | 0.130234 |
| Decile 1 | 0.123584 |
| Minimum | 0 |
|
|
- Mean = 0.146672
- Std.dev = 0.0197453
- 27 items below graph minimum of 0.0748124
- 169 items above graph maximum of 0.221127
|
2 Instances
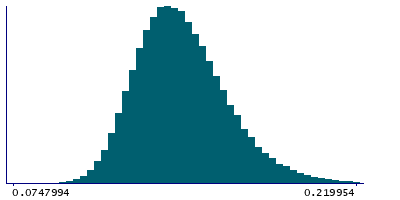
Instance 2 : Imaging visit (2014+)
79,147 participants, 79,147 items
| Maximum | 0.410101 |
| Decile 9 | 0.172483 |
| Decile 8 | 0.162075 |
| Decile 7 | 0.155223 |
| Decile 6 | 0.149702 |
| Median | 0.144817 |
| Decile 4 | 0.140169 |
| Decile 3 | 0.135496 |
| Decile 2 | 0.130287 |
| Decile 1 | 0.123622 |
| Minimum | 0 |
|
|
- Mean = 0.146763
- Std.dev = 0.0197716
- 24 items below graph minimum of 0.0747602
- 157 items above graph maximum of 0.221345
|
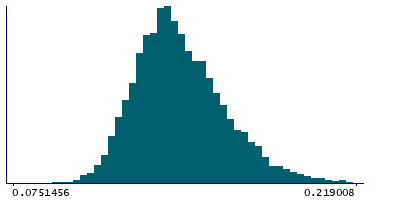
Instance 3 : First repeat imaging visit (2019+)
4,758 participants, 4,758 items
| Maximum | 0.231731 |
| Decile 9 | 0.171059 |
| Decile 8 | 0.160178 |
| Decile 7 | 0.153518 |
| Decile 6 | 0.147633 |
| Median | 0.142846 |
| Decile 4 | 0.138604 |
| Decile 3 | 0.134374 |
| Decile 2 | 0.129465 |
| Decile 1 | 0.123109 |
| Minimum | 0 |
|
|
- Mean = 0.145164
- Std.dev = 0.0192407
- 3 items below graph minimum of 0.0751585
- 7 items above graph maximum of 0.219009
|
Notes
Weighted-mean OD (orientation dispersion index) in tract right cingulate gyrus part of cingulum (from dMRI data)
0 Related Data-Fields
There are no related data-fields
2 Applications
| Application ID | Title |
|---|
| 17689 | Genetic, environmental and lifestyle predictors of brain/cognitive-related outcomes. |
| 22783 | The joint analysis of imaging data and genetic data for early tumor detection, prevention, diagnosis and treatment |

