Data
83,905 items of data are available, covering 79,378 participants.
Defined-instances run from 2 to 3, labelled using Instancing
2.
Units of measurement are AU.
| Maximum | 0.542405 |
| Decile 9 | 0.324068 |
| Decile 8 | 0.310769 |
| Decile 7 | 0.302394 |
| Decile 6 | 0.295529 |
| Median | 0.289439 |
| Decile 4 | 0.283532 |
| Decile 3 | 0.277443 |
| Decile 2 | 0.270323 |
| Decile 1 | 0.260542 |
| Minimum | 0 |
|

|
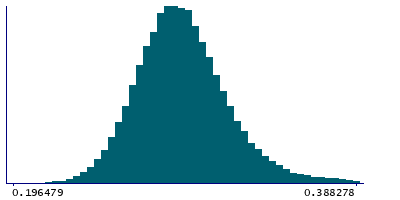
- Mean = 0.291507
- Std.dev = 0.0270279
- 24 items below graph minimum of 0.197016
- 423 items above graph maximum of 0.387593
|
2 Instances
Instance 2 : Imaging visit (2014+)
79,147 participants, 79,147 items
| Maximum | 0.542405 |
| Decile 9 | 0.323971 |
| Decile 8 | 0.310531 |
| Decile 7 | 0.302146 |
| Decile 6 | 0.295283 |
| Median | 0.289158 |
| Decile 4 | 0.283251 |
| Decile 3 | 0.277141 |
| Decile 2 | 0.270027 |
| Decile 1 | 0.260265 |
| Minimum | 0 |
|
|
- Mean = 0.291268
- Std.dev = 0.027103
- 20 items below graph minimum of 0.196559
- 401 items above graph maximum of 0.387677
|
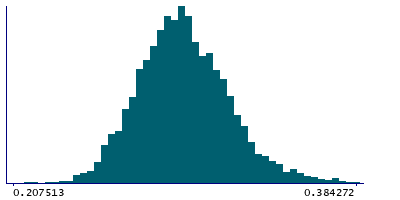
Instance 3 : First repeat imaging visit (2019+)
4,758 participants, 4,758 items
| Maximum | 0.427698 |
| Decile 9 | 0.325401 |
| Decile 8 | 0.314306 |
| Decile 7 | 0.306541 |
| Decile 6 | 0.299396 |
| Median | 0.293971 |
| Decile 4 | 0.288467 |
| Decile 3 | 0.282582 |
| Decile 2 | 0.275728 |
| Decile 1 | 0.26641 |
| Minimum | 0 |
|
|
- Mean = 0.295488
- Std.dev = 0.0254183
- 3 items below graph minimum of 0.207419
- 20 items above graph maximum of 0.384392
|
Notes
Weighted-mean OD (orientation dispersion index) in tract right parahippocampal part of cingulum (from dMRI data)
0 Related Data-Fields
There are no related data-fields
2 Applications
| Application ID | Title |
|---|
| 17689 | Genetic, environmental and lifestyle predictors of brain/cognitive-related outcomes. |
| 22783 | The joint analysis of imaging data and genetic data for early tumor detection, prevention, diagnosis and treatment |

