Data
83,905 items of data are available, covering 79,378 participants.
Defined-instances run from 2 to 3, labelled using Instancing
2.
Units of measurement are AU.
| Maximum | 0.301164 |
| Decile 9 | 0.142767 |
| Decile 8 | 0.137324 |
| Decile 7 | 0.133731 |
| Decile 6 | 0.130823 |
| Median | 0.128226 |
| Decile 4 | 0.125712 |
| Decile 3 | 0.123154 |
| Decile 2 | 0.120236 |
| Decile 1 | 0.116331 |
| Minimum | 0 |
|
|
- Mean = 0.129081
- Std.dev = 0.0109784
- 19 items below graph minimum of 0.0898954
- 231 items above graph maximum of 0.169203
|
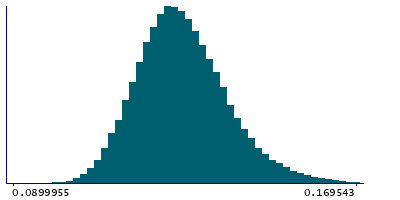
2 Instances
Instance 2 : Imaging visit (2014+)
79,147 participants, 79,147 items
| Maximum | 0.301164 |
| Decile 9 | 0.142651 |
| Decile 8 | 0.137243 |
| Decile 7 | 0.133628 |
| Decile 6 | 0.13072 |
| Median | 0.12814 |
| Decile 4 | 0.125628 |
| Decile 3 | 0.123074 |
| Decile 2 | 0.120129 |
| Decile 1 | 0.116233 |
| Minimum | 0 |
|

|
- Mean = 0.128989
- Std.dev = 0.0109801
- 18 items below graph minimum of 0.0898152
- 219 items above graph maximum of 0.169069
|
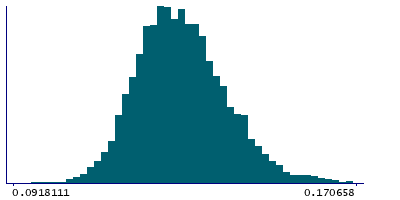
Instance 3 : First repeat imaging visit (2019+)
4,758 participants, 4,758 items
| Maximum | 0.224474 |
| Decile 9 | 0.14438 |
| Decile 8 | 0.13888 |
| Decile 7 | 0.135216 |
| Decile 6 | 0.132452 |
| Median | 0.129843 |
| Decile 4 | 0.127136 |
| Decile 3 | 0.124711 |
| Decile 2 | 0.121872 |
| Decile 1 | 0.118097 |
| Minimum | 0 |
|
|
- Mean = 0.130612
- Std.dev = 0.0108364
- 1 item below graph minimum of 0.0918138
- 14 items above graph maximum of 0.170663
|
Notes
Weighted-mean OD (orientation dispersion index) in tract forceps major (from dMRI data)
0 Related Data-Fields
There are no related data-fields
2 Applications
| Application ID | Title |
|---|
| 17689 | Genetic, environmental and lifestyle predictors of brain/cognitive-related outcomes. |
| 22783 | The joint analysis of imaging data and genetic data for early tumor detection, prevention, diagnosis and treatment |

