Data
83,905 items of data are available, covering 79,378 participants.
Defined-instances run from 2 to 3, labelled using Instancing
2.
Units of measurement are AU.
| Maximum | 0.360252 |
| Decile 9 | 0.105623 |
| Decile 8 | 0.0968196 |
| Decile 7 | 0.0911848 |
| Decile 6 | 0.0868216 |
| Median | 0.0829635 |
| Decile 4 | 0.0793548 |
| Decile 3 | 0.075737 |
| Decile 2 | 0.071755 |
| Decile 1 | 0.0664621 |
| Minimum | 0 |
|

|
- Mean = 0.0848704
- Std.dev = 0.0163613
- 324 items above graph maximum of 0.144784
|
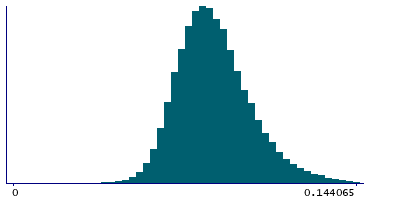
2 Instances
Instance 2 : Imaging visit (2014+)
79,147 participants, 79,147 items
| Maximum | 0.360252 |
| Decile 9 | 0.105805 |
| Decile 8 | 0.0970245 |
| Decile 7 | 0.0913656 |
| Decile 6 | 0.0870008 |
| Median | 0.0831232 |
| Decile 4 | 0.0794919 |
| Decile 3 | 0.075859 |
| Decile 2 | 0.071841 |
| Decile 1 | 0.0665219 |
| Minimum | 0 |
|
|
- Mean = 0.0850127
- Std.dev = 0.0164226
- 303 items above graph maximum of 0.145088
|
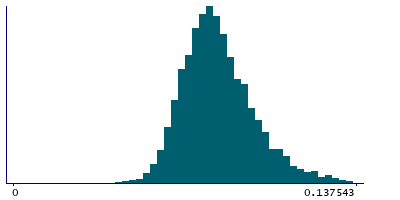
Instance 3 : First repeat imaging visit (2019+)
4,758 participants, 4,758 items
| Maximum | 0.204107 |
| Decile 9 | 0.101589 |
| Decile 8 | 0.0933641 |
| Decile 7 | 0.0879709 |
| Decile 6 | 0.0839108 |
| Median | 0.0805076 |
| Decile 4 | 0.0774941 |
| Decile 3 | 0.0741166 |
| Decile 2 | 0.0703517 |
| Decile 1 | 0.0656271 |
| Minimum | 0.024813 |
|
|
- Mean = 0.0825034
- Std.dev = 0.0151098
- 24 items above graph maximum of 0.13755
|
Notes
Weighted-mean ISOVF (isotropic or free water volume fraction) in tract right superior longitudinal fasciculus (from dMRI data)
0 Related Data-Fields
There are no related data-fields
2 Applications
| Application ID | Title |
|---|
| 17689 | Genetic, environmental and lifestyle predictors of brain/cognitive-related outcomes. |
| 22783 | The joint analysis of imaging data and genetic data for early tumor detection, prevention, diagnosis and treatment |

