Data
70,319 items of data are available, covering 66,458 participants.
Defined-instances run from 2 to 3, labelled using Instancing
2.
Units of measurement are percent.
| Maximum | 5.861 |
| Decile 9 | 0.657 |
| Decile 8 | 0.55 |
| Decile 7 | 0.486 |
| Decile 6 | 0.439 |
| Median | 0.398 |
| Decile 4 | 0.362 |
| Decile 3 | 0.326 |
| Decile 2 | 0.287 |
| Decile 1 | 0.236 |
| Minimum | -0.245 |
|

|
- Mean = 0.431264
- Std.dev = 0.199086
- 2 items below graph minimum of -0.185
- 660 items above graph maximum of 1.078
|
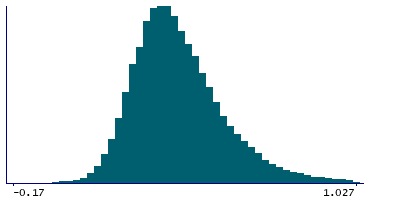
2 Instances
Instance 2 : Imaging visit (2014+)
66,035 participants, 66,035 items
| Maximum | 5.861 |
| Decile 9 | 0.659 |
| Decile 8 | 0.552 |
| Decile 7 | 0.488 |
| Decile 6 | 0.44 |
| Median | 0.399 |
| Decile 4 | 0.363 |
| Decile 3 | 0.326 |
| Decile 2 | 0.287 |
| Decile 1 | 0.236 |
| Minimum | -0.245 |
|
|
- Mean = 0.432235
- Std.dev = 0.200511
- 2 items below graph minimum of -0.187
- 627 items above graph maximum of 1.082
|
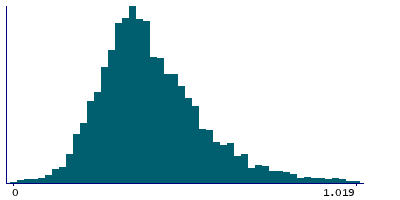
Instance 3 : First repeat imaging visit (2019+)
4,284 participants, 4,284 items
| Maximum | 3.235 |
| Decile 9 | 0.6275 |
| Decile 8 | 0.528 |
| Decile 7 | 0.472 |
| Decile 6 | 0.4255 |
| Median | 0.387 |
| Decile 4 | 0.355 |
| Decile 3 | 0.323 |
| Decile 2 | 0.2875 |
| Decile 1 | 0.236 |
| Minimum | 0.009 |
|
|
- Mean = 0.416296
- Std.dev = 0.174982
- 29 items above graph maximum of 1.019
|