Data
84,921 items of data are available, covering 80,351 participants.
Defined-instances run from 2 to 3, labelled using Instancing
2.
Units of measurement are mm3.
| Maximum | 168584 |
| Decile 9 | 13456 |
| Decile 8 | 8111 |
| Decile 7 | 5660 |
| Decile 6 | 4196 |
| Median | 3203.5 |
| Decile 4 | 2502 |
| Decile 3 | 1936 |
| Decile 2 | 1450 |
| Decile 1 | 968 |
| Minimum | 9 |
|

|
- Mean = 5835.54
- Std.dev = 7751.92
- 2428 items above graph maximum of 25944
|
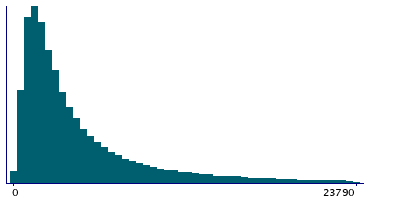
2 Instances
Instance 2 : Imaging visit (2014+)
80,161 participants, 80,161 items
| Maximum | 168584 |
| Decile 9 | 13548.5 |
| Decile 8 | 8180.5 |
| Decile 7 | 5690 |
| Decile 6 | 4219 |
| Median | 3220 |
| Decile 4 | 2513 |
| Decile 3 | 1942 |
| Decile 2 | 1455 |
| Decile 1 | 970 |
| Minimum | 9 |
|
|
- Mean = 5874.4
- Std.dev = 7815.61
- 2292 items above graph maximum of 26127
|
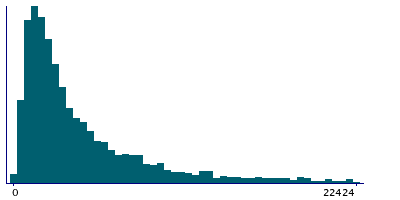
Instance 3 : First repeat imaging visit (2019+)
4,760 participants, 4,760 items
| Maximum | 76853 |
| Decile 9 | 11727 |
| Decile 8 | 7295 |
| Decile 7 | 5152 |
| Decile 6 | 3857 |
| Median | 2942 |
| Decile 4 | 2319 |
| Decile 3 | 1833 |
| Decile 2 | 1366 |
| Decile 1 | 942 |
| Minimum | 82 |
|
|
- Mean = 5181.19
- Std.dev = 6552.97
- 138 items above graph maximum of 22512
|
Notes
Total volume of white matter hyperintensities (from T1 and T2_FLAIR images)
0 Related Data-Fields
There are no related data-fields
2 Applications
| Application ID | Title |
|---|
| 17689 | Genetic, environmental and lifestyle predictors of brain/cognitive-related outcomes. |
| 22783 | The joint analysis of imaging data and genetic data for early tumor detection, prevention, diagnosis and treatment |


