Data
64,065 items of data are available, covering 53,016 participants.
Some values have special meanings defined by Data-Coding
100291.
Defined-instances run from 0 to 3, labelled using Instancing
2.
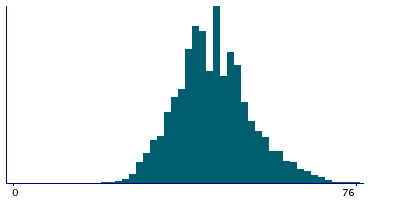
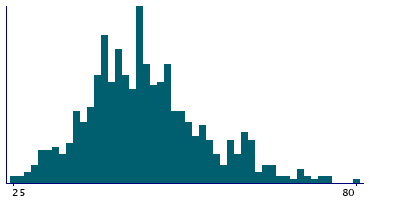
Units of measurement are years.
| Maximum | 83 |
| Decile 9 | 55 |
| Decile 8 | 51 |
| Decile 7 | 48 |
| Decile 6 | 46 |
| Median | 44 |
| Decile 4 | 42 |
| Decile 3 | 40 |
| Decile 2 | 38 |
| Decile 1 | 34 |
| Minimum | 10 |
|
|
- There are 73 distinct values.
- Mean = 44.4208
- Std.dev = 8.44638
- 36 items above graph maximum of 76
- 80 items have value -3 (Prefer not to answer)
- 1426 items have value -1 (Do not know)
|
4 Instances
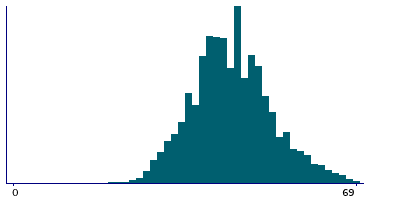
Instance 0 : Initial assessment visit (2006-2010) at which participants were recruited and consent given
50,987 participants, 50,987 items
| Maximum | 69 |
| Decile 9 | 55 |
| Decile 8 | 50 |
| Decile 7 | 48 |
| Decile 6 | 45 |
| Median | 44 |
| Decile 4 | 42 |
| Decile 3 | 40 |
| Decile 2 | 37 |
| Decile 1 | 34 |
| Minimum | 10 |
|
|
- There are 59 distinct values.
- Mean = 43.9273
- Std.dev = 8.0388
- 61 items have value -3 (Prefer not to answer)
- 1124 items have value -1 (Do not know)
|
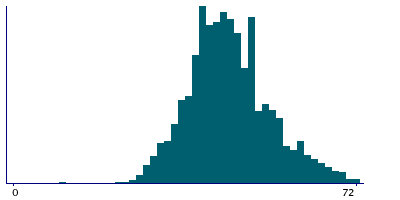
Instance 1 : First repeat assessment visit (2012-13)
2,099 participants, 2,099 items
| Maximum | 72 |
| Decile 9 | 57 |
| Decile 8 | 52 |
| Decile 7 | 49 |
| Decile 6 | 47 |
| Median | 45 |
| Decile 4 | 42 |
| Decile 3 | 40 |
| Decile 2 | 39 |
| Decile 1 | 35 |
| Minimum | 10 |
|
|
- There are 50 distinct values.
- Mean = 45.341
- Std.dev = 8.54515
- 1 items have value -3 (Prefer not to answer)
- 45 items have value -1 (Do not know)
|
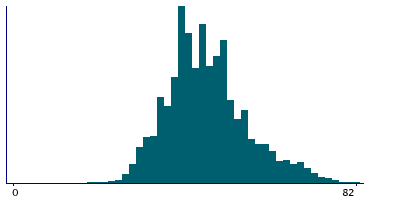
Instance 2 : Imaging visit (2014+)
9,192 participants, 9,192 items
| Maximum | 83 |
| Decile 9 | 60 |
| Decile 8 | 54 |
| Decile 7 | 50 |
| Decile 6 | 48 |
| Median | 45 |
| Decile 4 | 43 |
| Decile 3 | 41 |
| Decile 2 | 39 |
| Decile 1 | 35 |
| Minimum | 12 |
|
|
- There are 68 distinct values.
- Mean = 46.4647
- Std.dev = 9.72096
- 17 items have value -3 (Prefer not to answer)
- 204 items have value -1 (Do not know)
|
Instance 3 : First repeat imaging visit (2019+)
1,787 participants, 1,787 items
| Maximum | 83 |
| Decile 9 | 62 |
| Decile 8 | 55 |
| Decile 7 | 50 |
| Decile 6 | 48 |
| Median | 45 |
| Decile 4 | 43 |
| Decile 3 | 41 |
| Decile 2 | 39 |
| Decile 1 | 35 |
| Minimum | 10 |
|
|
- There are 61 distinct values.
- Mean = 46.9348
- Std.dev = 10.3261
- 1 items have value -3 (Prefer not to answer)
- 53 items have value -1 (Do not know)
|
Notes
ACE touchscreen question "How old were you when you had your hysterectomy?"
The following checks were performed:
- If answer < 0 then rejected
- If answer > Participants age then rejected
- If answer < 35 then participant asked to confirm
- If answer > 69 then participant asked to confirm
- If answer < Age when had the only child or < Age when had the last child then participant asked to confirm
If the participant activated the Help button they were shown the message:
If you are unsure, please provide an estimate or select Do not know.
|
Field 2824 was collected from women who indicated they have had a hysterectomy (womb removed), as defined by their answers to Field 2724 and Field 2724
Coding 100291 defines 2 special values:
- -1 represents "Do not know"
- -3 represents "Prefer not to answer"
2 Related Data-Fields
| Field ID | Description | Relationship |
|---|
| 3591 | Ever had hysterectomy (womb removed) | Field 3591 affects who was asked to answer Current Field |
| 2724 | Had menopause | Field 2724 affects who was asked to answer Current Field |
4 Applications
| Application ID | Title |
|---|
| 26629 | Cross-cultural variations in female reproductive health and non-communicable diseases: analysis of 500,000 participants from the UKBiobank and the InterLACE consortium |
| 5791 | Development and validation of risk prediction model for breast and ovarian cancers |
| 17435 | Exploring the genetics of irritable bowel syndrome: the ?bellygenes? initiative (project approved by bbmri-lpc) |
| 871 | Genetic factors associated with being at different extremes of the reproductive lifespan |


