Data
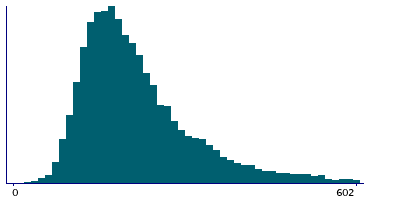
263,082 items of data are available, covering 209,210 participants.
Defined-instances run from 0 to 3, labelled using Instancing
2.
| Maximum | 119275 |
| Decile 9 | 390 |
| Decile 8 | 308 |
| Decile 7 | 262 |
| Decile 6 | 230 |
| Median | 204 |
| Decile 4 | 183 |
| Decile 3 | 163 |
| Decile 2 | 143 |
| Decile 1 | 119 |
| Minimum | 5 |
|
|
- There are 1273 distinct values.
- Mean = 236.514
- Std.dev = 271.98
- 3403 items above graph maximum of 661
|
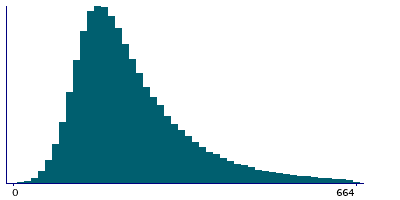
4 Instances
Instance 0 : Initial assessment visit (2006-2010) at which participants were recruited and consent given
141,982 participants, 141,982 items
| Maximum | 5043 |
| Decile 9 | 403 |
| Decile 8 | 318 |
| Decile 7 | 270 |
| Decile 6 | 236 |
| Median | 209 |
| Decile 4 | 186 |
| Decile 3 | 165 |
| Decile 2 | 144 |
| Decile 1 | 117 |
| Minimum | 5 |
|
|
- There are 1197 distinct values.
- Mean = 241.482
- Std.dev = 135.277
- 1839 items above graph maximum of 689
|
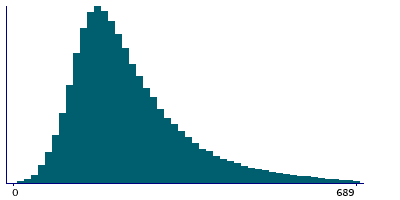
Instance 1 : First repeat assessment visit (2012-13)
18,086 participants, 18,086 items
| Maximum | 1882 |
| Decile 9 | 377 |
| Decile 8 | 298 |
| Decile 7 | 254 |
| Decile 6 | 224 |
| Median | 201 |
| Decile 4 | 181 |
| Decile 3 | 162 |
| Decile 2 | 143 |
| Decile 1 | 120 |
| Minimum | 28 |
|
|
- There are 774 distinct values.
- Mean = 231.046
- Std.dev = 123.498
- 254 items above graph maximum of 634
|
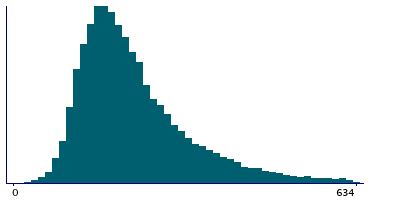
Instance 2 : Imaging visit (2014+)
84,774 participants, 84,774 items
| Maximum | 119275 |
| Decile 9 | 375 |
| Decile 8 | 298 |
| Decile 7 | 254 |
| Decile 6 | 224 |
| Median | 200 |
| Decile 4 | 180 |
| Decile 3 | 161 |
| Decile 2 | 142 |
| Decile 1 | 120 |
| Minimum | 7 |
|
|
- There are 999 distinct values.
- Mean = 231.824
- Std.dev = 439.014
- 1116 items above graph maximum of 630
|
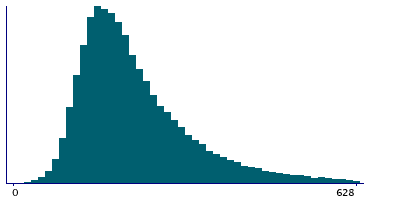
Instance 3 : First repeat imaging visit (2019+)
18,240 participants, 18,240 items
| Maximum | 2510 |
| Decile 9 | 364 |
| Decile 8 | 291 |
| Decile 7 | 249 |
| Decile 6 | 220 |
| Median | 197 |
| Decile 4 | 177 |
| Decile 3 | 159 |
| Decile 2 | 141 |
| Decile 1 | 119 |
| Minimum | 8 |
|
|
- There are 725 distinct values.
- Mean = 225.063
- Std.dev = 114.666
- 196 items above graph maximum of 609
|

