Data
466,874 items of data are available, covering 394,296 participants.
Defined-instances run from 0 to 3, labelled using Instancing
2.
Units of measurement are minutes/week.
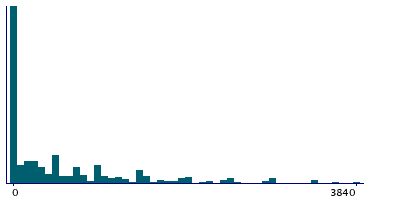
| Maximum | 10080 |
| Decile 9 | 1920 |
| Decile 8 | 1120 |
| Decile 7 | 720 |
| Decile 6 | 480 |
| Median | 240 |
| Decile 4 | 80 |
| Decile 3 | 0 |
| Decile 2 | 0 |
| Decile 1 | 0 |
| Minimum | 0 |
|

|
- Mean = 684.316
- Std.dev = 1156.09
- 10612 items above graph maximum of 3840
|
4 Instances
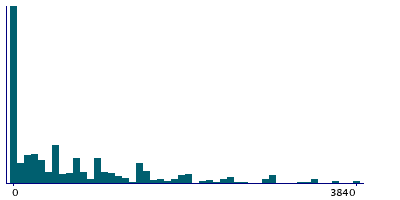
Instance 0 : Initial assessment visit (2006-2010) at which participants were recruited and consent given
385,014 participants, 385,014 items
| Maximum | 10080 |
| Decile 9 | 1920 |
| Decile 8 | 1080 |
| Decile 7 | 720 |
| Decile 6 | 480 |
| Median | 240 |
| Decile 4 | 80 |
| Decile 3 | 0 |
| Decile 2 | 0 |
| Decile 1 | 0 |
| Minimum | 0 |
|
|
- Mean = 678.947
- Std.dev = 1170.89
- 8981 items above graph maximum of 3840
|
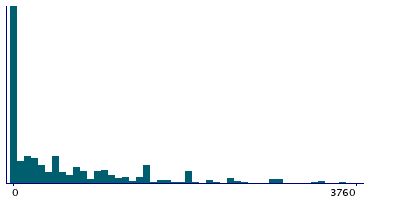
Instance 1 : First repeat assessment visit (2012-13)
17,298 participants, 17,298 items
| Maximum | 10080 |
| Decile 9 | 1880 |
| Decile 8 | 1080 |
| Decile 7 | 720 |
| Decile 6 | 480 |
| Median | 240 |
| Decile 4 | 80 |
| Decile 3 | 0 |
| Decile 2 | 0 |
| Decile 1 | 0 |
| Minimum | 0 |
|
|
- Mean = 639.791
- Std.dev = 1003.48
- 335 items above graph maximum of 3760
|
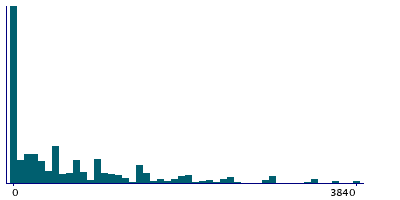
Instance 2 : Imaging visit (2014+)
59,292 participants, 59,292 items
| Maximum | 10080 |
| Decile 9 | 1920 |
| Decile 8 | 1200 |
| Decile 7 | 800 |
| Decile 6 | 480 |
| Median | 320 |
| Decile 4 | 160 |
| Decile 3 | 0 |
| Decile 2 | 0 |
| Decile 1 | 0 |
| Minimum | 0 |
|
|
- Mean = 726.173
- Std.dev = 1103.65
- 1257 items above graph maximum of 3840
|
Instance 3 : First repeat imaging visit (2019+)
5,270 participants, 5,270 items
| Maximum | 10080 |
| Decile 9 | 1920 |
| Decile 8 | 1440 |
| Decile 7 | 960 |
| Decile 6 | 560 |
| Median | 360 |
| Decile 4 | 160 |
| Decile 3 | 0 |
| Decile 2 | 0 |
| Decile 1 | 0 |
| Minimum | 0 |
|
|
- Mean = 751.756
- Std.dev = 1097.03
- 102 items above graph maximum of 3840
|


