Data
375,730 items of data are available, covering 310,716 participants.
Some values have special meanings defined by Data-Coding
100291.
Defined-instances run from 0 to 3, labelled using Instancing
2.
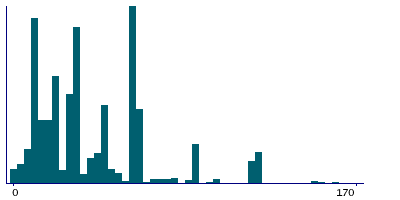
Units of measurement are minutes/day.
| Maximum | 1440 |
| Decile 9 | 90 |
| Decile 8 | 60 |
| Decile 7 | 60 |
| Decile 6 | 40 |
| Median | 30 |
| Decile 4 | 30 |
| Decile 3 | 20 |
| Decile 2 | 15 |
| Decile 1 | 10 |
| Minimum | 0 |
|

|
- There are 203 distinct values.
- Mean = 44.4386
- Std.dev = 46.7153
- 9564 items above graph maximum of 170
- 975 items have value -3 (Prefer not to answer)
- 28818 items have value -1 (Do not know)
|
4 Instances
Instance 0 : Initial assessment visit (2006-2010) at which participants were recruited and consent given
294,516 participants, 294,516 items
| Maximum | 1440 |
| Decile 9 | 90 |
| Decile 8 | 60 |
| Decile 7 | 60 |
| Decile 6 | 40 |
| Median | 30 |
| Decile 4 | 30 |
| Decile 3 | 20 |
| Decile 2 | 15 |
| Decile 1 | 10 |
| Minimum | 0 |
|
|
- There are 193 distinct values.
- Mean = 44.857
- Std.dev = 48.1663
- 7814 items above graph maximum of 170
- 858 items have value -3 (Prefer not to answer)
- 24380 items have value -1 (Do not know)
|
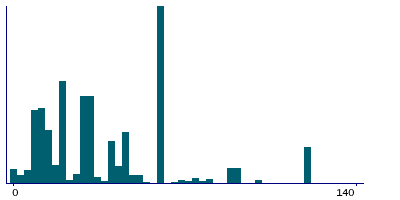
Instance 1 : First repeat assessment visit (2012-13)
12,980 participants, 12,980 items
| Maximum | 1000 |
| Decile 9 | 75 |
| Decile 8 | 60 |
| Decile 7 | 50 |
| Decile 6 | 40 |
| Median | 30 |
| Decile 4 | 30 |
| Decile 3 | 20 |
| Decile 2 | 15 |
| Decile 1 | 10 |
| Minimum | 0 |
|
|
- There are 80 distinct values.
- Mean = 41.8897
- Std.dev = 41.1926
- 271 items above graph maximum of 140
- 16 items have value -3 (Prefer not to answer)
- 712 items have value -1 (Do not know)
|
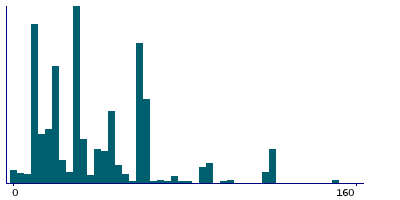
Instance 2 : Imaging visit (2014+)
59,814 participants, 59,814 items
| Maximum | 860 |
| Decile 9 | 80 |
| Decile 8 | 60 |
| Decile 7 | 60 |
| Decile 6 | 45 |
| Median | 30 |
| Decile 4 | 30 |
| Decile 3 | 20 |
| Decile 2 | 15 |
| Decile 1 | 10 |
| Minimum | 0 |
|
|
- There are 118 distinct values.
- Mean = 42.9679
- Std.dev = 40.8177
- 1324 items above graph maximum of 150
- 87 items have value -3 (Prefer not to answer)
- 3383 items have value -1 (Do not know)
|
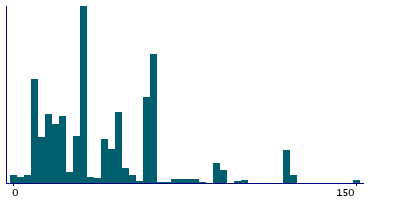
Instance 3 : First repeat imaging visit (2019+)
8,420 participants, 8,420 items
| Maximum | 600 |
| Decile 9 | 90 |
| Decile 8 | 60 |
| Decile 7 | 60 |
| Decile 6 | 45 |
| Median | 30 |
| Decile 4 | 30 |
| Decile 3 | 20 |
| Decile 2 | 15 |
| Decile 1 | 10 |
| Minimum | 0 |
|
|
- There are 73 distinct values.
- Mean = 44.6147
- Std.dev = 43.5729
- 220 items above graph maximum of 170
- 14 items have value -3 (Prefer not to answer)
- 343 items have value -1 (Do not know)
|
Notes
ACE touchscreen question "How many minutes did you usually spend doing vigorous activities on a typical DAY?"
The following checks were performed:
- If answer < 0 then rejected
- If answer > 1440 then rejected
- If answer < 10 then participant asked to confirm
- If answer > 300 then participant asked to confirm
If the participant activated the Help button they were shown the message:
If the time you usually spend doing vigorous physical activity on each day
of the week varies a lot, give an average of the time you spend doing vigorous
physical activity.
|
This information was collected from participants who indicated that they did vigorous physical activities for 10 minutes on at least 1 day per week in the previous 4 weeks, as defined by their answers to Field 904
Coding 100291 defines 2 special values:
- -1 represents "Do not know"
- -3 represents "Prefer not to answer"
2 Related Data-Fields
| Field ID | Description | Relationship |
|---|
| 10971 | Duration of vigorous physical activi ... | Field 10971 is the pilot-study predecessor of main-study Current Field |
| 904 | Number of days/week of vigorous phys ... | Field 904 determined who was asked Current Field |


