Data
643,074 items of data are available, covering 500,989 participants.
Some values have special meanings defined by Data-Coding
100373.
Defined-instances run from 0 to 3, labelled using Instancing
2.
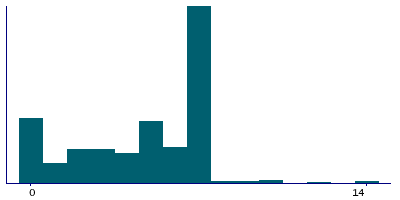
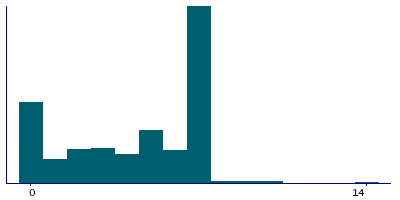
Units of measurement are bowls/week.
| Maximum | 77 |
| Decile 9 | 7 |
| Decile 8 | 7 |
| Decile 7 | 7 |
| Decile 6 | 6 |
| Median | 5 |
| Decile 4 | 5 |
| Decile 3 | 3 |
| Decile 2 | 2 |
| Decile 1 | 0 |
| Minimum | 0 |
|
|
- There are 31 distinct values.
- Mean = 4.64507
- Std.dev = 2.74067
- 326 items above graph maximum of 14
- 29265 items have value -10 (Less than one)
- 477 items have value -3 (Prefer not to answer)
- 1737 items have value -1 (Do not know)
|
4 Instances
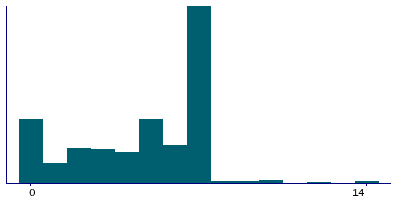
Instance 0 : Initial assessment visit (2006-2010) at which participants were recruited and consent given
500,923 participants, 500,923 items
| Maximum | 77 |
| Decile 9 | 7 |
| Decile 8 | 7 |
| Decile 7 | 7 |
| Decile 6 | 6 |
| Median | 5 |
| Decile 4 | 5 |
| Decile 3 | 3 |
| Decile 2 | 2 |
| Decile 1 | 0 |
| Minimum | 0 |
|
|
- There are 30 distinct values.
- Mean = 4.68354
- Std.dev = 2.71954
- 276 items above graph maximum of 14
- 22267 items have value -10 (Less than one)
- 456 items have value -3 (Prefer not to answer)
- 1614 items have value -1 (Do not know)
|
Instance 1 : First repeat assessment visit (2012-13)
20,314 participants, 20,314 items
| Maximum | 30 |
| Decile 9 | 7 |
| Decile 8 | 7 |
| Decile 7 | 7 |
| Decile 6 | 7 |
| Median | 6 |
| Decile 4 | 5 |
| Decile 3 | 4 |
| Decile 2 | 2 |
| Decile 1 | 0 |
| Minimum | 0 |
|
|
- There are 20 distinct values.
- Mean = 4.99318
- Std.dev = 2.69182
- 14 items above graph maximum of 14
- 801 items have value -10 (Less than one)
- 3 items have value -3 (Prefer not to answer)
- 17 items have value -1 (Do not know)
|
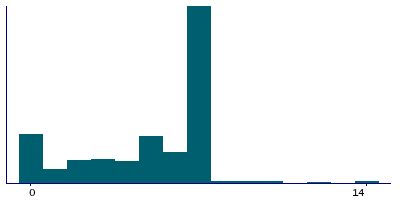
Instance 2 : Imaging visit (2014+)
100,917 participants, 100,917 items
| Maximum | 57 |
| Decile 9 | 7 |
| Decile 8 | 7 |
| Decile 7 | 7 |
| Decile 6 | 6 |
| Median | 5 |
| Decile 4 | 4 |
| Decile 3 | 3 |
| Decile 2 | 1 |
| Decile 1 | 0 |
| Minimum | 0 |
|
|
- There are 22 distinct values.
- Mean = 4.43622
- Std.dev = 2.81879
- 29 items above graph maximum of 14
- 5172 items have value -10 (Less than one)
- 17 items have value -3 (Prefer not to answer)
- 99 items have value -1 (Do not know)
|
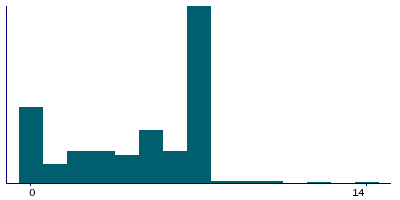
Instance 3 : First repeat imaging visit (2019+)
20,920 participants, 20,920 items
| Maximum | 21 |
| Decile 9 | 7 |
| Decile 8 | 7 |
| Decile 7 | 7 |
| Decile 6 | 6 |
| Median | 5 |
| Decile 4 | 4 |
| Decile 3 | 3 |
| Decile 2 | 1 |
| Decile 1 | 0 |
| Minimum | 0 |
|
|
- There are 18 distinct values.
- Mean = 4.38618
- Std.dev = 2.83127
- 7 items above graph maximum of 14
- 1025 items have value -10 (Less than one)
- 1 items have value -3 (Prefer not to answer)
- 7 items have value -1 (Do not know)
|
Notes
ACE touchscreen question "How many bowls of cereal do you eat a WEEK?"
The following checks were performed:
- If answer < 0 then rejected
- If answer > 99 then rejected
- If answer > 14 then participant asked to confirm
If the participant activated the Help button they were shown the message:
Please provide an average considering your intake over the last year.
If you are unsure, please provide an estimate or select Do not know.
|
Coding 100373 defines 3 special values:
- -10 represents "Less than one"
- -1 represents "Do not know"
- -3 represents "Prefer not to answer"
1 Related Data-Field
| Field ID | Description | Relationship |
|---|
| 1468 | Cereal type | Field 1468 was collected from all participants except those who indicated that they do not eat cereal or less than one bowl of cereal each week, as defined by their answers to Current Field |
Problem running application query


