Data
184,293 items of data are available, covering 153,906 participants.
Defined-instances run from 0 to 3, labelled using Instancing
2.
Units of measurement are Units.
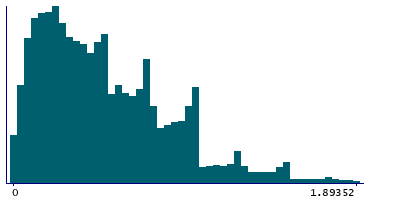
| Maximum | 7 |
| Decile 9 | 1 |
| Decile 8 | 0.80303 |
| Decile 7 | 0.664773 |
| Decile 6 | 0.521739 |
| Median | 0.430556 |
| Decile 4 | 0.336957 |
| Decile 3 | 0.25 |
| Decile 2 | 0.179487 |
| Decile 1 | 0.103846 |
| Minimum | 0 |
|
|
- Mean = 0.518787
- Std.dev = 0.406753
- 1926 items above graph maximum of 1.89615
|
4 Instances
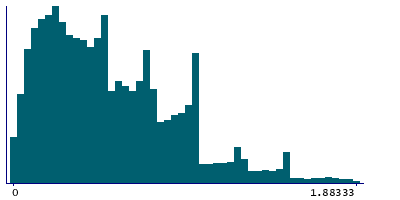
Instance 0 : Initial assessment visit (2006-2010) at which participants were recruited and consent given
150,773 participants, 150,773 items
| Maximum | 7 |
| Decile 9 | 1 |
| Decile 8 | 0.857143 |
| Decile 7 | 0.706897 |
| Decile 6 | 0.570312 |
| Median | 0.465909 |
| Decile 4 | 0.36875 |
| Decile 3 | 0.277778 |
| Decile 2 | 0.19898 |
| Decile 1 | 0.116667 |
| Minimum | 0 |
|
|
- Mean = 0.550786
- Std.dev = 0.418751
- 1883 items above graph maximum of 1.88333
|
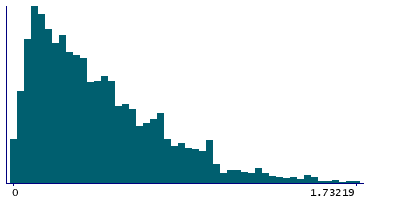
Instance 1 : First repeat assessment visit (2012-13)
5,336 participants, 5,336 items
| Maximum | 3 |
| Decile 9 | 0.910485 |
| Decile 8 | 0.701941 |
| Decile 7 | 0.551724 |
| Decile 6 | 0.44898 |
| Median | 0.354167 |
| Decile 4 | 0.277266 |
| Decile 3 | 0.208082 |
| Decile 2 | 0.144868 |
| Decile 1 | 0.0887841 |
| Minimum | 0 |
|
|
- Mean = 0.442823
- Std.dev = 0.357031
- 46 items above graph maximum of 1.73219
|
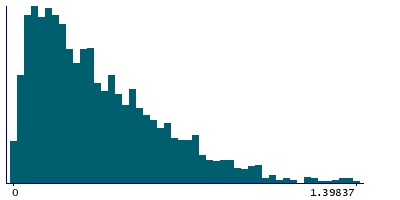
Instance 2 : Imaging visit (2014+)
23,595 participants, 23,595 items
| Maximum | 3.5 |
| Decile 9 | 0.75 |
| Decile 8 | 0.581633 |
| Decile 7 | 0.459459 |
| Decile 6 | 0.365566 |
| Median | 0.289139 |
| Decile 4 | 0.22807 |
| Decile 3 | 0.17 |
| Decile 2 | 0.119318 |
| Decile 1 | 0.0705764 |
| Minimum | 0 |
|

|
- Mean = 0.366572
- Std.dev = 0.29946
- 194 items above graph maximum of 1.42942
|
Instance 3 : First repeat imaging visit (2019+)
4,589 participants, 4,589 items
| Maximum | 3.54545 |
| Decile 9 | 0.703012 |
| Decile 8 | 0.533995 |
| Decile 7 | 0.423273 |
| Decile 6 | 0.336002 |
| Median | 0.268189 |
| Decile 4 | 0.205687 |
| Decile 3 | 0.153932 |
| Decile 2 | 0.108696 |
| Decile 1 | 0.0656816 |
| Minimum | 0 |
|
|
- Mean = 0.338429
- Std.dev = 0.285977
- 38 items above graph maximum of 1.34034
|
Notes
Average number of pack-years smoked by an individual each year, over their adult lifetime, calculated using pack-years data field. Pack years as a proportion of lifespan exposed to smoking is defined as pack years divided by the number of years between the participants' age at recruitment and the age of 16:
Pack years / (Age at recruitment - 16)
This derived data field has come from Professor Martin Tobin at the University of Leicester.

