Data
646,197 items of data are available, covering 501,938 participants.
Defined-instances run from 0 to 3, labelled using Instancing
2.
Units of measurement are years.
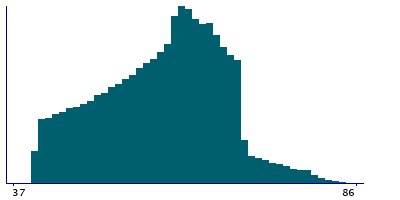
| Maximum | 87 |
| Decile 9 | 69 |
| Decile 8 | 66 |
| Decile 7 | 64 |
| Decile 6 | 62 |
| Median | 60 |
| Decile 4 | 57 |
| Decile 3 | 54 |
| Decile 2 | 50 |
| Decile 1 | 45 |
| Minimum | 37 |
|
|
- There are 51 distinct values.
- Mean = 58.6701
- Std.dev = 9.01245
|
4 Instances
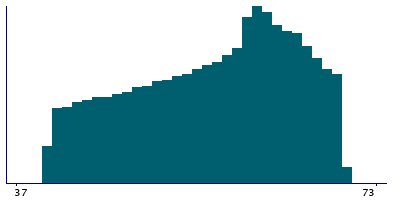
Instance 0 : Initial assessment visit (2006-2010) at which participants were recruited and consent given
501,938 participants, 501,938 items
| Maximum | 73 |
| Decile 9 | 67 |
| Decile 8 | 64 |
| Decile 7 | 62 |
| Decile 6 | 60 |
| Median | 58 |
| Decile 4 | 55 |
| Decile 3 | 52 |
| Decile 2 | 48 |
| Decile 1 | 44 |
| Minimum | 37 |
|
|
- There are 37 distinct values.
- Mean = 56.5326
- Std.dev = 8.09492
|
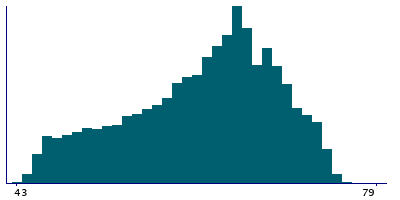
Instance 1 : First repeat assessment visit (2012-13)
20,323 participants, 20,323 items
| Maximum | 79 |
| Decile 9 | 70 |
| Decile 8 | 68 |
| Decile 7 | 66 |
| Decile 6 | 65 |
| Median | 63 |
| Decile 4 | 61 |
| Decile 3 | 58 |
| Decile 2 | 54 |
| Decile 1 | 50 |
| Minimum | 43 |
|
|
- There are 35 distinct values.
- Mean = 61.448
- Std.dev = 7.39925
|
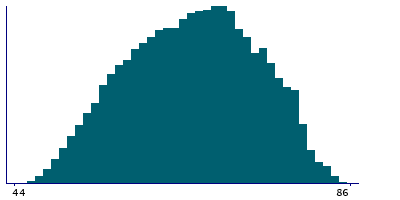
Instance 2 : Imaging visit (2014+)
102,489 participants, 102,489 items
| Maximum | 87 |
| Decile 9 | 77 |
| Decile 8 | 74 |
| Decile 7 | 71 |
| Decile 6 | 69 |
| Median | 67 |
| Decile 4 | 64 |
| Decile 3 | 62 |
| Decile 2 | 59 |
| Decile 1 | 56 |
| Minimum | 44 |
|
|
- There are 44 distinct values.
- Mean = 66.471
- Std.dev = 7.84919
|
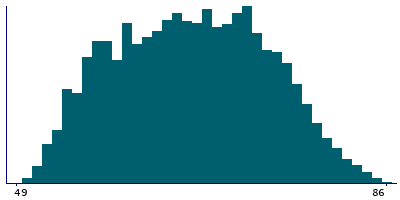
Instance 3 : First repeat imaging visit (2019+)
21,447 participants, 21,447 items
| Maximum | 87 |
| Decile 9 | 79 |
| Decile 8 | 76 |
| Decile 7 | 74 |
| Decile 6 | 71 |
| Median | 69 |
| Decile 4 | 67 |
| Decile 3 | 64 |
| Decile 2 | 61 |
| Decile 1 | 58 |
| Minimum | 49 |
|
|
- There are 39 distinct values.
- Mean = 68.7853
- Std.dev = 7.7489
|