Data
466,632 items of data are available, covering 394,110 participants.
Defined-instances run from 0 to 3, labelled using Instancing
2.
Units of measurement are minutes/week.
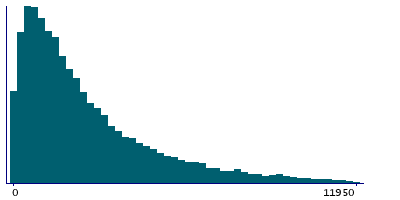
| Maximum | 19278 |
| Decile 9 | 6155.5 |
| Decile 8 | 4239 |
| Decile 7 | 3114 |
| Decile 6 | 2382 |
| Median | 1851 |
| Decile 4 | 1404 |
| Decile 3 | 1032 |
| Decile 2 | 693 |
| Decile 1 | 358 |
| Minimum | 0 |
|
|
- Mean = 2675.81
- Std.dev = 2625.01
- 5293 items above graph maximum of 11953
|
4 Instances
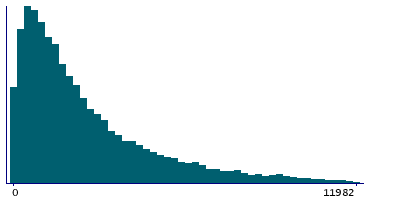
Instance 0 : Initial assessment visit (2006-2010) at which participants were recruited and consent given
384,836 participants, 384,836 items
| Maximum | 19278 |
| Decile 9 | 6156 |
| Decile 8 | 4212 |
| Decile 7 | 3066 |
| Decile 6 | 2340 |
| Median | 1786 |
| Decile 4 | 1373 |
| Decile 3 | 988.5 |
| Decile 2 | 660 |
| Decile 1 | 330 |
| Minimum | 0 |
|
|
- Mean = 2644.94
- Std.dev = 2653.2
- 4574 items above graph maximum of 11982
|
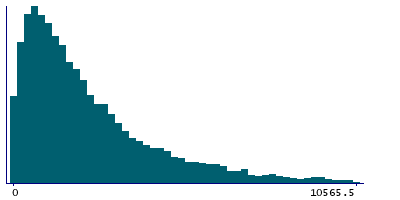
Instance 1 : First repeat assessment visit (2012-13)
17,287 participants, 17,287 items
| Maximum | 19278 |
| Decile 9 | 5456 |
| Decile 8 | 3781.25 |
| Decile 7 | 2841.75 |
| Decile 6 | 2208 |
| Median | 1732.5 |
| Decile 4 | 1332 |
| Decile 3 | 984 |
| Decile 2 | 666 |
| Decile 1 | 346.5 |
| Minimum | 0 |
|
|
- Mean = 2415.14
- Std.dev = 2298.85
- 190 items above graph maximum of 10565.5
|
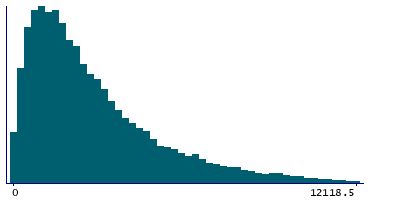
Instance 2 : Imaging visit (2014+)
59,243 participants, 59,243 items
| Maximum | 19278 |
| Decile 9 | 6332.5 |
| Decile 8 | 4506 |
| Decile 7 | 3474 |
| Decile 6 | 2773 |
| Median | 2206 |
| Decile 4 | 1740 |
| Decile 3 | 1342 |
| Decile 2 | 942 |
| Decile 1 | 547.5 |
| Minimum | 0 |
|
|
- Mean = 2923.27
- Std.dev = 2522.5
- 476 items above graph maximum of 12117.5
|
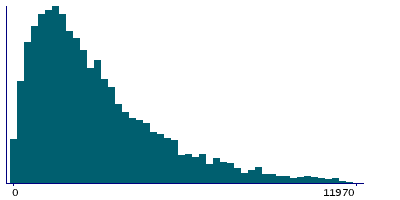
Instance 3 : First repeat imaging visit (2019+)
5,266 participants, 5,266 items
| Maximum | 19278 |
| Decile 9 | 6292.5 |
| Decile 8 | 4612.5 |
| Decile 7 | 3573 |
| Decile 6 | 2919 |
| Median | 2346 |
| Decile 4 | 1866 |
| Decile 3 | 1455 |
| Decile 2 | 1048.75 |
| Decile 1 | 615 |
| Minimum | 0 |
|
|
- Mean = 3003.12
- Std.dev = 2477.16
- 50 items above graph maximum of 11970
|


