Data
50,584 items of data are available, covering 46,667 participants.
Defined-instances run from 2 to 3, labelled using Instancing
2.
Units of measurement are degrees.
| Maximum | 270 |
| Decile 9 | 70 |
| Decile 8 | 58 |
| Decile 7 | 48 |
| Decile 6 | 39 |
| Median | 28 |
| Decile 4 | 18 |
| Decile 3 | 8 |
| Decile 2 | -4 |
| Decile 1 | -21 |
| Minimum | -90 |
|

|
- There are 326 distinct values.
- Mean = 27.6766
- Std.dev = 37.4872
- 139 items above graph maximum of 161
|
2 Instances
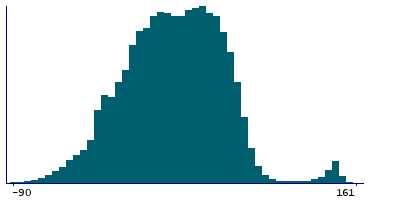
Instance 2 : Imaging visit (2014+)
46,392 participants, 46,392 items
| Maximum | 270 |
| Decile 9 | 70 |
| Decile 8 | 58 |
| Decile 7 | 48 |
| Decile 6 | 38 |
| Median | 28 |
| Decile 4 | 18 |
| Decile 3 | 8 |
| Decile 2 | -4 |
| Decile 1 | -21 |
| Minimum | -90 |
|
|
- There are 324 distinct values.
- Mean = 27.6684
- Std.dev = 37.7151
- 130 items above graph maximum of 161
|
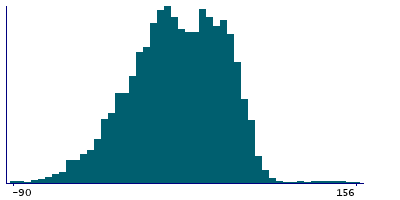
Instance 3 : First repeat imaging visit (2019+)
4,192 participants, 4,192 items
| Maximum | 269 |
| Decile 9 | 69 |
| Decile 8 | 59 |
| Decile 7 | 49 |
| Decile 6 | 39 |
| Median | 29 |
| Decile 4 | 19 |
| Decile 3 | 10 |
| Decile 2 | -1 |
| Decile 1 | -18 |
| Minimum | -90 |
|
|
- There are 195 distinct values.
- Mean = 27.7669
- Std.dev = 34.8659
- 10 items above graph maximum of 156
|